Inventory Optimization Software for Manufacturing: Guide
Elevate your supply chain efficiency with advanced inventory optimization software. Reduce costs & boost profits with smart stock management in 2026.
Written by AI for Manufacturing
Monday morning often starts with the wrong problem. Three SKU lines are waiting on material, one distribution center is carrying excess finished goods, and planners are reconciling two spreadsheets before they can decide what to buy. Inventory optimization software is the decision layer that calculates where inventory should sit, when replenishment should start, and how much stock each plant, warehouse, and service location should hold, using demand, lead time, service-level targets, and supply constraints.
For a manufacturer, that decision layer covers more than finished goods. It can manage raw materials, work in process, maintenance, repair and operations inventory, and spare parts while balancing stockout risk against carrying cost across a network. The category has expanded from a niche planning tool into a substantial software market. One independent estimate projects inventory optimization software growth from USD 1.31 billion in 2025 to USD 1.44 billion in 2026 and USD 2.31 billion by 2031, a 9.91% CAGR from 2026 to 2031 (Mordor Intelligence market estimate).
The manufacturing AI payoff is practical. A trusted optimization layer creates a consistent decision record for procurement, production scheduling, warehouse transfers, and S&OP, instead of forcing each team to interpret a different spreadsheet. The inventory management use-case overview is a useful reference point for connecting those decisions to broader manufacturing AI work.
Table of Contents
- What Inventory Optimization Software Actually Does on a Plant Floor
- The Core Mechanics Behind Inventory Optimization
- How AI and Machine Learning Change the Optimization Equation
- Data, Integrations, and the Manufacturing Tech Stack
- KPIs and ROI Examples Plant Leaders Care About
- Implementation Roadmap and Common Pitfalls
- A Manufacturing-Fit Vendor Evaluation Checklist
- Why Inventory Optimization Is the Backbone of AI in Manufacturing
What Inventory Optimization Software Actually Does on a Plant Floor
Inventory optimization software turns operational signals into replenishment decisions. It sets reorder points, safety-stock levels, lot sizes, and multi-echelon inventory targets while respecting demand patterns, supplier lead times, production constraints, and required service levels. The software doesn't merely report what is in stock. It calculates what should be stocked, where it should be held, and when the next action should occur.
The Monday-morning test
Start with the exceptions that consume planner time:
- Material shortage: A component is physically available at another site, but the planning system treats the locations independently.
- Misaligned buffers: One distribution center has excess stock while another is close to a customer-facing shortage.
- Spreadsheet overrides: A planner changes a min-max value because the system doesn't reflect a supplier's recent lead-time behavior.
- Hidden production exposure: A spare part has little recorded demand but can stop a critical asset when it fails.
A manufacturing-fit system should connect those exceptions to the underlying decision logic. If demand changes, the model should show how the reorder point, safety stock, transfer recommendation, or purchase proposal changes. If a supplier becomes less reliable, the impact should appear in the policy rather than remain in a planner's private notes.
The decision layer across inventory types
Finished goods are only one part of the problem. Raw materials must arrive before production consumes them. WIP must move through routings without creating unnecessary queues. MRO and spare-parts policies must account for equipment criticality and long, variable lead times, not just historical demand.
This matters for AI in manufacturing because downstream models need stable, interpretable signals. Procurement algorithms can't optimize reliably when stock balances are stale. Scheduling systems can't prioritize accurately when material availability is overstated. Inventory optimization software supplies a shared operational state that lets those models act on the same version of demand, supply, and constraint data.
Practical rule: If a planner can't explain why a recommendation changed, operations won't trust the automation.
The Core Mechanics Behind Inventory Optimization
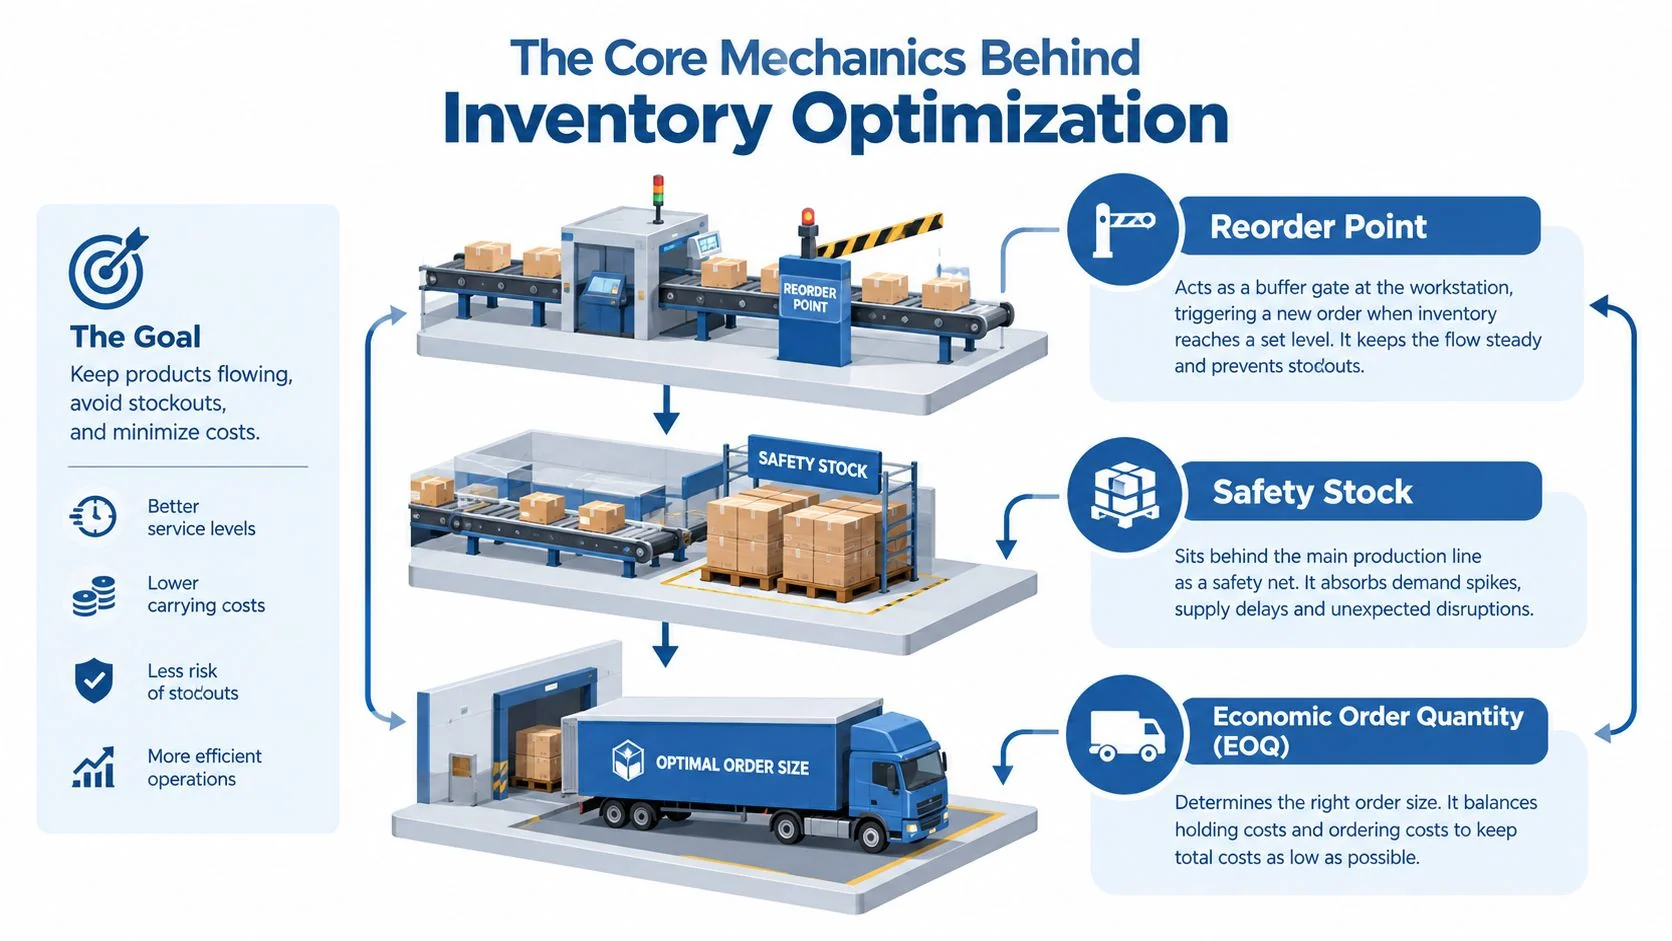
The mechanics are familiar to experienced planners, but the software connects them across items and locations. A reorder point is the stock level that triggers replenishment. It commonly combines average demand during lead time with safety stock, while safety stock absorbs variability in demand and lead time (reorder point and safety stock explanation).
On a plant floor, think of the reorder point as a gate before a workstation. When available and incoming stock reaches the gate, the system starts replenishment. Safety stock is the reserve pallet behind the main line. It protects production or customer service when demand rises, a supplier arrives late, or a process consumes more material than planned.
Economic order quantity, or EOQ, is the truck-size decision. A small truck arrives often and limits holding exposure, but creates more ordering activity. A large truck reduces order frequency but ties up more cash and storage capacity. Modern software may extend or replace simple EOQ logic with lot-size, minimum-order, capacity, shelf-life, and supplier constraints.
Prioritize effort before optimizing the network
ABC classification gives planners a control lens. Class A items are typically 10–20% of part numbers and 70–80% of total consumption value, while class B items are about 20–30% of parts and 15–25% of value. Class C items commonly represent 50–70% of parts but only 5–10% of value (ABC classification guidance).
The point isn't to treat every item with equal precision. A critical A item may deserve frequent review and a differentiated service target. A low-value C item may use a simpler policy, unless its equipment criticality makes a shortage operationally dangerous.
Why multi-echelon optimization changes the decision
Multi-echelon inventory optimization, or MEIO, treats central warehouses, regional distribution centers, depots, local service points, suppliers, WIP, and finished goods as a connected network. It seeks the lowest total network cost while meeting service targets across tiers, rather than letting each site independently build its own buffer (Microsoft AppSource MEIO description).
That distinction is where many implementations create value. Inventory can move to the location where it protects the most demand or production risk, instead of accumulating duplicate safety stock in every facility. Don't promise a universal working-capital reduction without testing the network. The achievable result depends on topology, constraints, data quality, and the amount of inventory that can realistically be repositioned.
How AI and Machine Learning Change the Optimization Equation
A static policy can perform well for stable demand and predictable lead times. It becomes fragile when orders arrive intermittently, suppliers shift promised dates, promotions distort history, or production constraints change the feasible replenishment plan. AI helps only when it addresses a specific failure mode and operates on data planners can trust.
Demand sensing adds short-horizon signals to the forecast, including recent orders, shipments, promotions, weather, and relevant machine or production telemetry. Its practical role is to update near-term demand expectations before a conventional replenishment policy reacts too slowly. It should complement the planning model, not replace it with an opaque prediction.
A benchmark study reported that MEIO alone reduced safety stock by 13%. MEIO combined with demand sensing reduced safety stock by 31% and lowered inventory by 4.5 days compared with traditional single-echelon management. The study also reported forecast-error improvements of 38% for top movers and 36% for tail items, and found that roughly 80% of safety stock is driven by forecast error (Forecasting and Inventory Benchmark Study). These figures are benchmarks, not deployment guarantees. Network structure, data quality, and policy settings determine the result at a specific manufacturer.
Match the method to the failure mode
| Method | Typical manufacturing gain | Best-fit condition | Watch-outs |
|---|---|---|---|
| Demand sensing | Lower short-horizon forecast error and faster response | Volatile demand, recent order changes, promotion effects | Weak event data and delayed transactions can create false signals |
| Supervised forecasting | Better demand estimates for repeatable or segmented patterns | Sufficient history, stable item definitions, useful external features | Lower forecast error does not automatically produce a better stock policy |
| MEIO | Network-wide buffer and positioning improvements | Multiple plants, warehouses, or service tiers | Local targets may conflict with global economics |
| Reinforcement learning | Adaptive replenishment policies under changing conditions | Capacitated, non-stationary networks with clear simulation or benchmarking | Harder to govern, explain, and validate than a conventional policy |
Reinforcement learning deserves controlled testing rather than automatic adoption. A deep reinforcement learning study using proximal policy optimization reported average cost improvements of 16.4% in a linear network, 11.3% in a divergent network, and 6.6% in a general network versus a benchmark solution. The spread is operationally important. Topology and constraints influence performance, so manufacturers should test the policy against their own network structure and baseline replenishment rules (MIT multi-echelon reinforcement learning report).
Practitioners can review AI inventory management methods for implementation patterns and related manufacturing examples. The production test is direct: does the model improve decisions during the conditions that create shortages, excess stock, and planner overrides?
Data, Integrations, and the Manufacturing Tech Stack
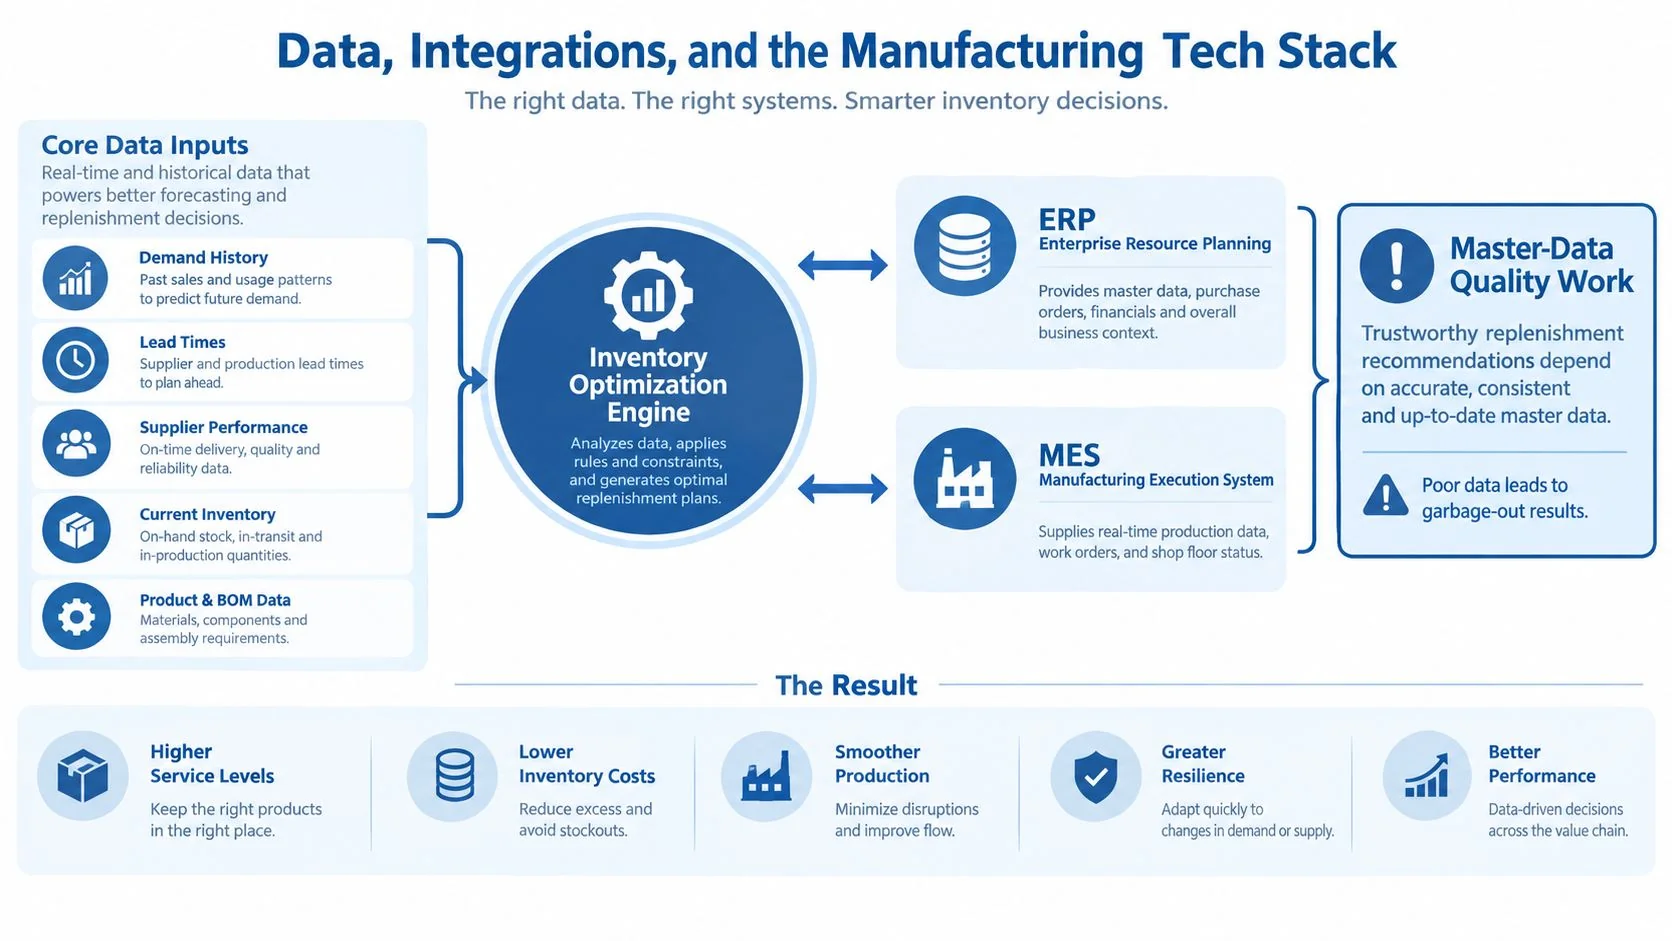
Optimization quality is limited by the quality of the item, location, transaction, and constraint data underneath it. The software needs a connected view of demand, on-hand inventory, open orders, supplier performance, production consumption, lead times, and service requirements. It also needs to understand how materials flow through bills of material, routings, plants, warehouses, and customer channels.
Build the minimum trusted data spine
A practical implementation usually maps these inputs:
- ERP records: Purchase orders, sales orders, inventory balances, receipts, issues, transfers, costs, and supplier terms.
- MES events: Production orders, actual consumption, scrap, yield, downtime, and completion timing.
- Planning structures: Bills of material, routings, lead-time calendars, lot-size rules, substitutions, and alternates.
- Location and item masters: Consistent identifiers, units of measure, stocking policies, and plant or warehouse ownership.
- Supplier data: Quoted lead times, actual receipt history, minimum order quantities, and delivery variability.
- Operational signals: IoT or machine telemetry where it improves demand, failure-risk, or consumption estimates.
The hardest work is often not model selection. It's resolving duplicate item numbers, incorrect units, obsolete locations, missing lead times, and transaction timing differences between systems. A model can produce mathematically consistent recommendations from bad inputs, which makes bad master data especially dangerous because the output may look authoritative.
Integrate decisions, not just records
ERP and MES connectivity should support a closed loop. The optimizer reads actual demand and supply conditions, produces a recommendation, sends approved actions into purchasing or production workflows, and receives the resulting transactions for measurement.
Use manufacturing data analytics guidance to frame the integration around decisions and ownership. Define who approves policy changes, who owns lead-time corrections, and how planners handle exceptions before the first model runs. That governance is part of the AI system, not administrative overhead.
KPIs and ROI Examples Plant Leaders Care About
Plant leaders need metrics that operations, supply chain, and finance can defend together. A dashboard of model scores has little value if customer service still sees shortages or finance cannot reconcile inventory movement. Start with outcomes tied to plant decisions.
Service level measures whether demand is fulfilled under the agreed definition, such as item availability or order fulfillment. Inventory days expresses stock as the amount of demand or consumption it represents. Forecast error compares predicted demand with actual demand, using one consistent definition across product families. Working capital connects inventory value with cash held in raw materials, WIP, finished goods, and spares.
Use a baseline that survives scrutiny
Before deployment, freeze a baseline by SKU, site, and inventory class. Separate planned production shortages from data errors, supplier failures from demand surprises, and deliberate service-level choices from accidental overstock. Otherwise, a project can claim improvement only because its measurement boundary changed.
| KPI | Baseline | Post-optimization range | Notes |
|---|---|---|---|
| Service level | Establish by product, site, and customer commitment | Set by policy, not a universal target | Report misses by cause and criticality |
| Inventory days | Calculate from validated on-hand and consumption data | Compare like-for-like periods and scope | Include raw materials, WIP, finished goods, or spares consistently |
| Forecast error | Segment by movers, intermittent items, and horizon | Use the 38% top-mover and 36% tail-item improvements cited earlier only where the same method and definitions apply | Forecast improvement must translate into policy improvement |
| Working capital | Value inventory at an agreed accounting basis | Attribute releases to approved policy changes | Reconcile recommendations with actual purchasing and consumption |
The financial case should trace the decision to cash: a change in safety stock or inventory positioning, lower or better-targeted on-hand exposure, preserved service, and realized inventory value. If the optimizer recommends lower stock while buyers continue placing old order quantities, the benefit remains theoretical.
Track overrides as well as headline KPIs. Frequent overrides may indicate poor inputs, an unsuitable service policy, or constraints missing from the model. That evidence helps plant leaders decide whether to change data, parameters, or operating rules.
For AI in manufacturing, this discipline separates a useful decision model from a dashboard experiment. A service-level gain created by uncontrolled stock is not optimization. A lower inventory balance that causes line stoppages is not a successful AI deployment. The result must hold across service, inventory, and cash measures under the same operating scope.
Implementation Roadmap and Common Pitfalls
A manufacturing rollout should begin with a narrow operational problem, not an enterprise-wide promise. Select a pilot where demand, supply, and service pain are visible, and where plant leadership can make policy decisions quickly.
Four phases that work in practice
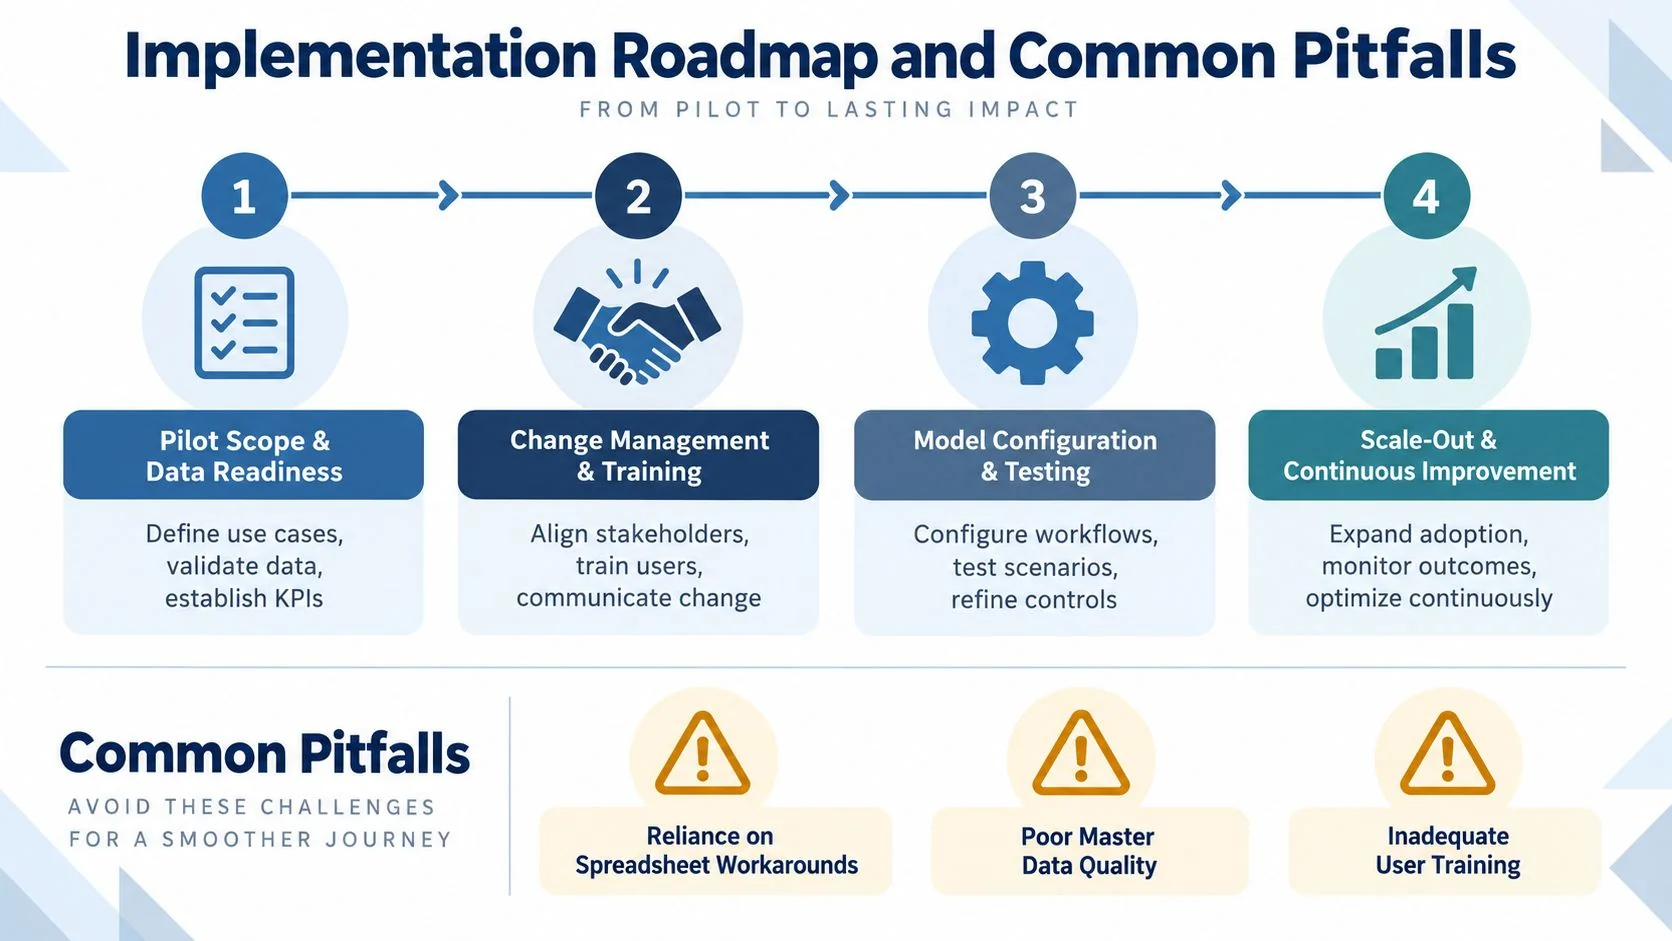
- Pilot scope and data readiness: Select representative SKU-site combinations, map ERP and MES fields, validate inventory movements, and document current planner rules. Include difficult items, not only clean high-volume products.
- Change management and training: Give planners a reason code for every recommendation, define approval rights, and teach users how to distinguish a model exception from a source-data exception.
- Model configuration and testing: Configure service targets, lot-sizing rules, lead-time behavior, BOM relationships, and capacity constraints. Run in shadow mode so recommendations can be compared with current decisions before automation.
- Scale-out and continuous improvement: Roll out plant by plant, monitor drift, review overrides, and create a formal process for updating master data and model parameters.
A full sequence can take 12–18 months when it includes data cleansing, calibration, shadow mode, governance, and plant-by-plant expansion. Treat that as a planning horizon, not a guaranteed delivery time. Pilot duration and scale depend on system fragmentation, item complexity, and the number of decision owners.
Pitfalls that quietly kill adoption
- Spreadsheet workarounds: Shadow calculations create competing policies. Retire them gradually, but make the software recommendation the auditable default.
- Tight exception thresholds: If every item triggers an alert, planners stop reading alerts. Prioritize by service risk, value, criticality, and actionability.
- Untrusted dashboards: Reconcile a sample of recommendations back to source transactions. Users trust what they can trace.
- Override habits: Capture the reason for each override and review recurring patterns. A repeated override may expose a missing constraint, not user resistance.
- Weak ownership: Assign named owners for item masters, lead times, service targets, and model performance.
The AI-in-manufacturing lesson is direct. Change management isn't separate from model performance. If the people who execute replenishment don't trust the recommendation, the algorithm never reaches the plant.
A Manufacturing-Fit Vendor Evaluation Checklist
A polished demo can hide a weak operating model. Ask the vendor to demonstrate decisions on representative manufacturing data, including a multi-level BOM, intermittent spare parts, constrained suppliers, and inventory distributed across more than one tier.
Score the decision engine
Require evidence for these capabilities:
- MEIO support: Can the system optimize central, regional, plant, and service inventories together?
- Scenario planning: Can users test lead-time shocks, capacity limits, demand changes, and service-level trade-offs?
- ERP and MES connectivity: Does the integration support actual transactions and production events, not only periodic file uploads?
- BOM and lot-size logic: Can the model account for component relationships, minimum order quantities, pack sizes, and substitutions?
- Explainability: Can a planner see which demand, lead-time, service, or constraint input changed the recommendation?
- Exception workflow: Can the system distinguish data issues from genuine supply or demand risks?
Use the matrix below during demonstrations. Fill it with observed behavior rather than vendor claims.
| Vendor | MEIO support | AI/ML capability | ERP/MES integration | Scenario planning | Transparency of logic | Deployment model |
|---|---|---|---|---|---|---|
| Vendor A | Demonstrate by network tier | Identify model and validation method | Test live transaction flow | Run a lead-time scenario | Inspect recommendation drivers | Cloud, on-premises, or hybrid |
| Vendor B | Test cross-site balancing | Separate forecasting from optimization | Validate APIs and batch options | Test capacity and service trade-offs | Review reason codes and audit trail | Cloud, on-premises, or hybrid |
| Vendor C | Test BOM and location relationships | Test intermittent and volatile items | Confirm ERP and MES coverage | Compare alternative policies | Require planner-readable explanations | Cloud, on-premises, or hybrid |
Don't rank vendors on interface polish alone. Ask how much human input remains after go-live, how often parameters need tuning, and what happens when the data is incomplete. Public evaluations note that many tools still require substantial human input and offer rule-based or limited automation, while implementation complexity and data quality remain material buyer concerns (inventory optimization software evaluation).
For broader evidence gathering, AI for Manufacturing maintains a searchable database of manufacturing AI implementations with use-case, technology, industry, company-size, outcome, and source-link fields. It can sit alongside vendor demos and internal pilots as one research input, not as a substitute for testing your own data.
Why Inventory Optimization Is the Backbone of AI in Manufacturing
Inventory optimization becomes the operational backbone of manufacturing AI when it creates a reliable relationship between demand, material availability, production capacity, and replenishment action. Predictive quality models need production context. Dynamic scheduling needs credible material dates. Energy optimization needs a schedule that reflects what can be produced with available inputs.
That makes the inventory data spine more important than any isolated forecasting model. SKU-location balances, supplier lead times, demand signals, service targets, and approved replenishment decisions should remain traceable across ERP, MES, planning, and execution workflows.
Connect models to plant outcomes
A stable optimization layer also provides a controlled environment for advanced methods. Reinforcement-learning agents can be evaluated against a known policy. Digital twins can test network changes using consistent inventory and capacity assumptions. Predictive models can consume the same demand and supply signals that planners use, rather than rebuilding disconnected datasets.
The market's expansion reflects that broader role. Inventory management software is projected at USD 3.44 billion in 2026, up from USD 3.17 billion in 2025, and USD 5.16 billion by 2031, at an 8.45% CAGR, according to one market estimate (inventory management software market report). The strategic question for a manufacturer isn't whether AI belongs in inventory planning. It's whether the planning layer is trustworthy enough to coordinate AI across the factory.
Manufacturers should start by selecting one network problem, validating the data behind it, and measuring service, inventory, forecast error, and realized working capital together. That disciplined foundation is what turns AI for manufacturing from disconnected pilots into production decisions that improve material availability, scheduling, quality, and energy performance.
If your plant is still managing safety stock, transfers, or replenishment through disconnected spreadsheets, map one SKU-site network and test the decision logic on real ERP and MES data. Use the results to define a focused pilot for inventory optimization software, then connect its verified outputs to your procurement, scheduling, and broader AI roadmap.
