Why Measure Outcomes in Manufacturing AI
See why measure outcomes decide scale, modify, or stop for manufacturing AI, using plant KPIs, baselines, and verified case evidence.
Written by AI for Manufacturing
Measuring outcomes means comparing a defined pre-deployment baseline with later changes in operations, risk, or cost. A launch report shows that a system was purchased or deployed; it does not show whether the plant improved. In KPMG's 2025 intelligent manufacturing report, 96% of manufacturing AI leaders surveyed reported operational or efficiency gains, while 45% reported measurable financial improvements.
That gap makes outcome measurement a control system for investment decisions. Track operational gains alongside the costs and trade-offs that determine whether they produce durable financial value. A model can make accurate predictions without improving plant results, and a gain in one metric can come at the expense of another. Use the evidence to decide whether to scale, modify, or stop.
Table of Contents
- What an Outcome Is in a Manufacturing AI Project
- Plant KPIs Worth Measuring Before You Scale
- Metrics You Should Refuse to Optimize Alone
- The Gap Between Efficiency Gains and Financial Results
- How to Measure a Pilot Under Real Plant Conditions
- How Comparable Case Evidence Changes the Decision
- Decide Whether to Scale Modify or Stop
What an Outcome Is in a Manufacturing AI Project
An output is an activity completed: a model deployed, alerts generated, operators trained, or inspections completed. An outcome is a change in operating conditions after the intervention, whether intended or unintended, positive or negative. Examples include higher throughput, lower scrap, reduced unplanned downtime, safer work, or lower total cost.
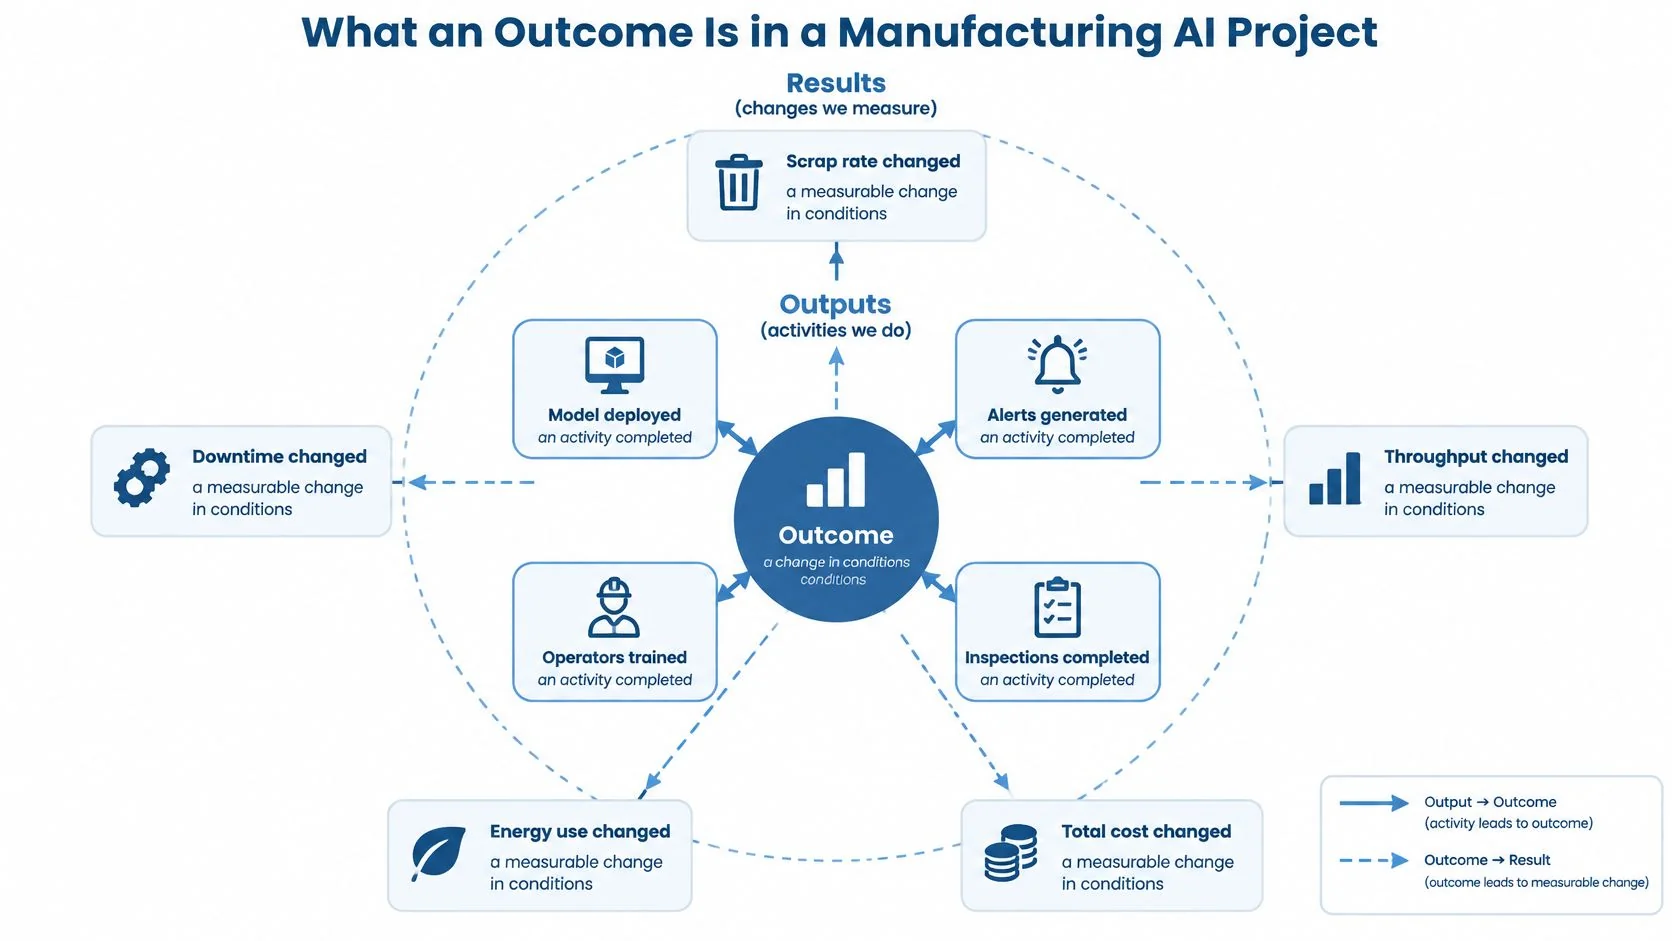
A technically successful deployment can still fail to deliver business value. Operators may rarely use its recommendations, the incoming data may deteriorate, or maintenance costs may rise. Even a genuine gain in one metric can be offset by a loss elsewhere, such as more output accompanied by worse quality or higher worker strain.
The World Bank results-measurement framework calls for indicators, baseline data, agreed targets, measurement units, collection methods, and assigned reporting responsibilities. The same discipline makes an industrial AI project more than a launch report: it connects the intervention to a defined operating objective and evidence that can support a management decision.
Record the decision basis before go-live
Before the model touches live production, write down:
- Operational objective: State the plant result the AI system is meant to change.
- Baseline and target: Record pre-deployment performance and a numeric target.
- KPI definition: Specify the unit and calculation method.
- Collection and ownership: Name the data source, collection method, and accountable data owner.
- Measurement window: Set a repeatable period, typically 8 to 12 production weeks on a named line and product scope.
This record makes it possible to compare results on a consistent basis and decide whether to scale, modify, or stop. The plant KPI table below turns those fields into measures for inspection, maintenance, and process-control projects.
Plant KPIs Worth Measuring Before You Scale
| Plant outcome | KPI treatment | Baseline to lock | Does not prove value |
|---|---|---|---|
| Unplanned downtime | Lost hours / scheduled hours, with planned stops excluded | Same line, schedule, and planned-stop rules for 8 to 12 production weeks | Alerts generated or model accuracy |
| Scrap and rework | Scrap quantity and rework quantity reported separately / produced quantity | Matched SKU mix and changeover rules | Inspections completed |
| Throughput | Good units per hour on the scoped line | Named line, shifts, and product scope | Higher utilization alone |
| Energy | kWh per good unit | Same product mix and meter boundary | Inference or software cost alone |
| Safety and escapes | Recordable incidents and escaped defects, tracked as guardrails | Pre-pilot incident and escape rates | Lab detection rate |
| Adoption | Accepted recommendations / recommendations shown | Weekly rate by shift during the pilot | Seats licensed or users trained |
| Financial result | Cost avoided or margin after integration, training, and idle capacity | Lagging view after steady state | Vendor payback slide |
Use ISO 22400's manufacturing KPI framework to make definitions consistent across production types and teams. It specifies KPI formulas, units, time behavior, user groups, and the production methodology each measure applies to. Those details matter because two plants can report different “uptime” improvements by using different denominators or classifying planned stops differently.
For each KPI, document the production scope, calculation formula, time window, data owner, and treatment of planned stops, scrap, rework, and changeovers. For downtime, count lost hours against scheduled hours and exclude planned stops according to rules fixed before the pilot. For quality, keep scrap and rework separate so a reduction in one doesn't conceal a rise in the other.
Lock the baseline before accepting a vendor demo as the project target. Carry the same formulas and exclusions into the pilot, scale-up, and steady state instead of inventing a new scorecard at each decision gate. For a related operating measure, see this guide to calculating OEE.
Metrics You Should Refuse to Optimize Alone
Higher line utilization can make a dashboard look better while the factory becomes less valuable. If maintenance time shrinks, quality worsens, or workload rises, utilization alone is not a sound scale signal. Treat outcome measurement as a control system: each primary metric needs a guardrail that can reveal what the headline number hides.
| Metric that improved | Harm it can hide | Guardrail to pair |
|---|---|---|
| Higher line utilization | Less maintenance flexibility, worse quality, more strain | Maintenance backlog, escapes, workload |
| Fewer alerts | Missed failures | Missed-failure rate and warning lead time |
| More inspections | Higher false rejects | False-reject rate and escaped defects |
| Lower reported downtime | Stops reclassified as planned | Fixed planned-stop rules |
| Higher model accuracy | No change in scrap or warranty | Scrap, warranty cost, override rate |
| Faster cycle time | Energy or safety loss | kWh per good unit and recordables |
Pair every primary KPI with a guardrail
Publish safety, quality escapes, maintenance backlog, energy per good unit, employee workload, model-override rate, and performance differences across shifts or sites beside the primary outcome. Use the same production scope and time window for each measure; otherwise, the comparison can reflect different operating conditions rather than a real trade-off.
Before crediting the AI system with a gain, check whether demand, staffing, production mix, or accounting changes could explain it. A reduction in reported downtime, for example, may come from reclassifying stops rather than improving equipment performance. Keep the classification rules fixed, and track actual production outcomes alongside model measures such as accuracy and alert volume.
Refusal rule: Don't set a bonus, vendor payment, or scale gate on a single optimized metric unless it has a paired guardrail.
The Gap Between Efficiency Gains and Financial Results
Among 183 manufacturing AI leaders surveyed by KPMG across eight countries, 96% reported operational or efficiency gains, while 45% reported measurable financial improvements. That gap shows why an operational win isn't automatically a durable business result.
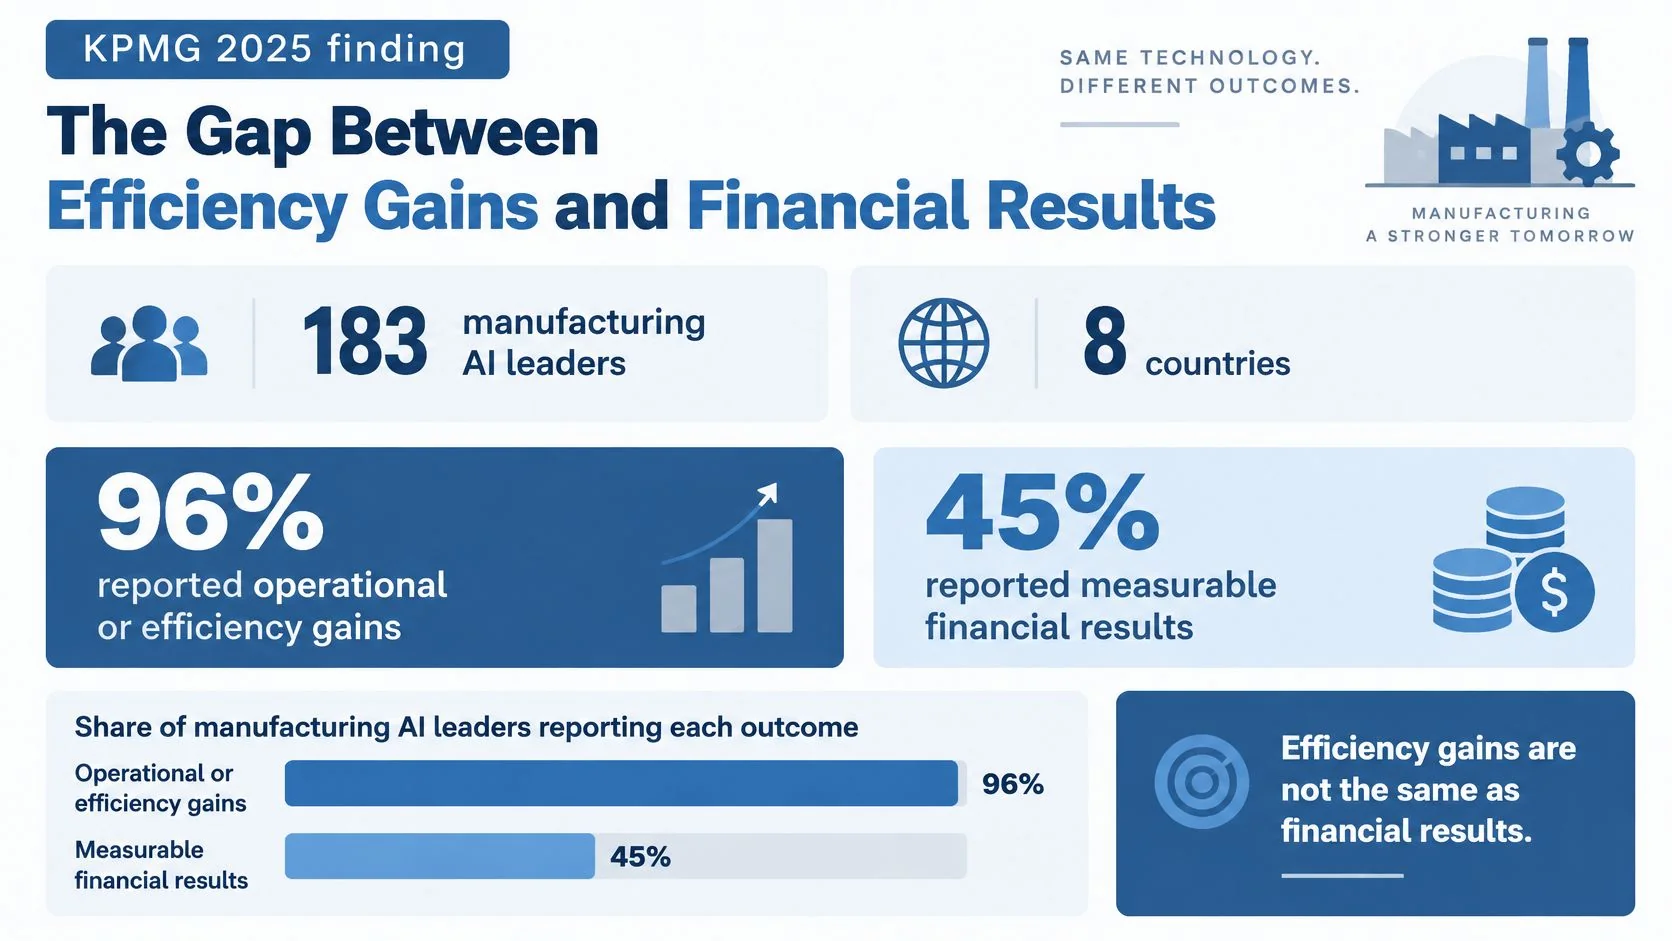
Integration work, training time, additional maintenance, software licenses, and capacity that is freed but never sold or removed can absorb the benefit. A faster line doesn't necessarily reduce costs if the plant still carries the same staffing and overhead. Likewise, lower scrap may not improve margin if the accounting records don't show the avoided material or rework cost.
KPMG's 2025 report on intelligent manufacturing says manufacturers consider productivity, revenue, profitability, workforce satisfaction, organizational adoption, and decision quality in ROI calculations. Tie those claims to the plant outcomes already being tracked, rather than adding a separate, disconnected scorecard. For working through assumptions, Build an AI ROI calculator can help organize costs and benefits, while manufacturing data analytics guidance can inform how teams structure operational evidence.
| Stage | Track | Evidence to require | Financial claim allowed |
|---|---|---|---|
| Pilot | Adoption and process compliance; early scrap or downtime movement | Baseline, window, and data owner locked | No financial claim |
| Scale-up | Lagging results: throughput, scrap, downtime | Results hold across shifts and variants | Cost avoided only with a comparison group |
| Steady state | Cost and margin after implementation costs | Measurement window, baseline, and comparison group stated | Yes, once finance traces hours or scrap to a cost center |
At the pilot stage, adoption and process compliance show whether the system is being used, while early movement in scrap or downtime indicates whether the intended outcome may be changing. During scale-up, require those results to hold across shifts and product variants. At steady state, translate durable operational results into cost or margin only after implementation expenses are included and the evidence states its baseline, measurement window, and comparison group.
Causality becomes shaky if demand, staffing, production mix, or accounting changes during the same measurement window. If finance can't trace the claimed hours or scrap to a cost center, the project hasn't yet demonstrated a financial outcome.
How to Measure a Pilot Under Real Plant Conditions
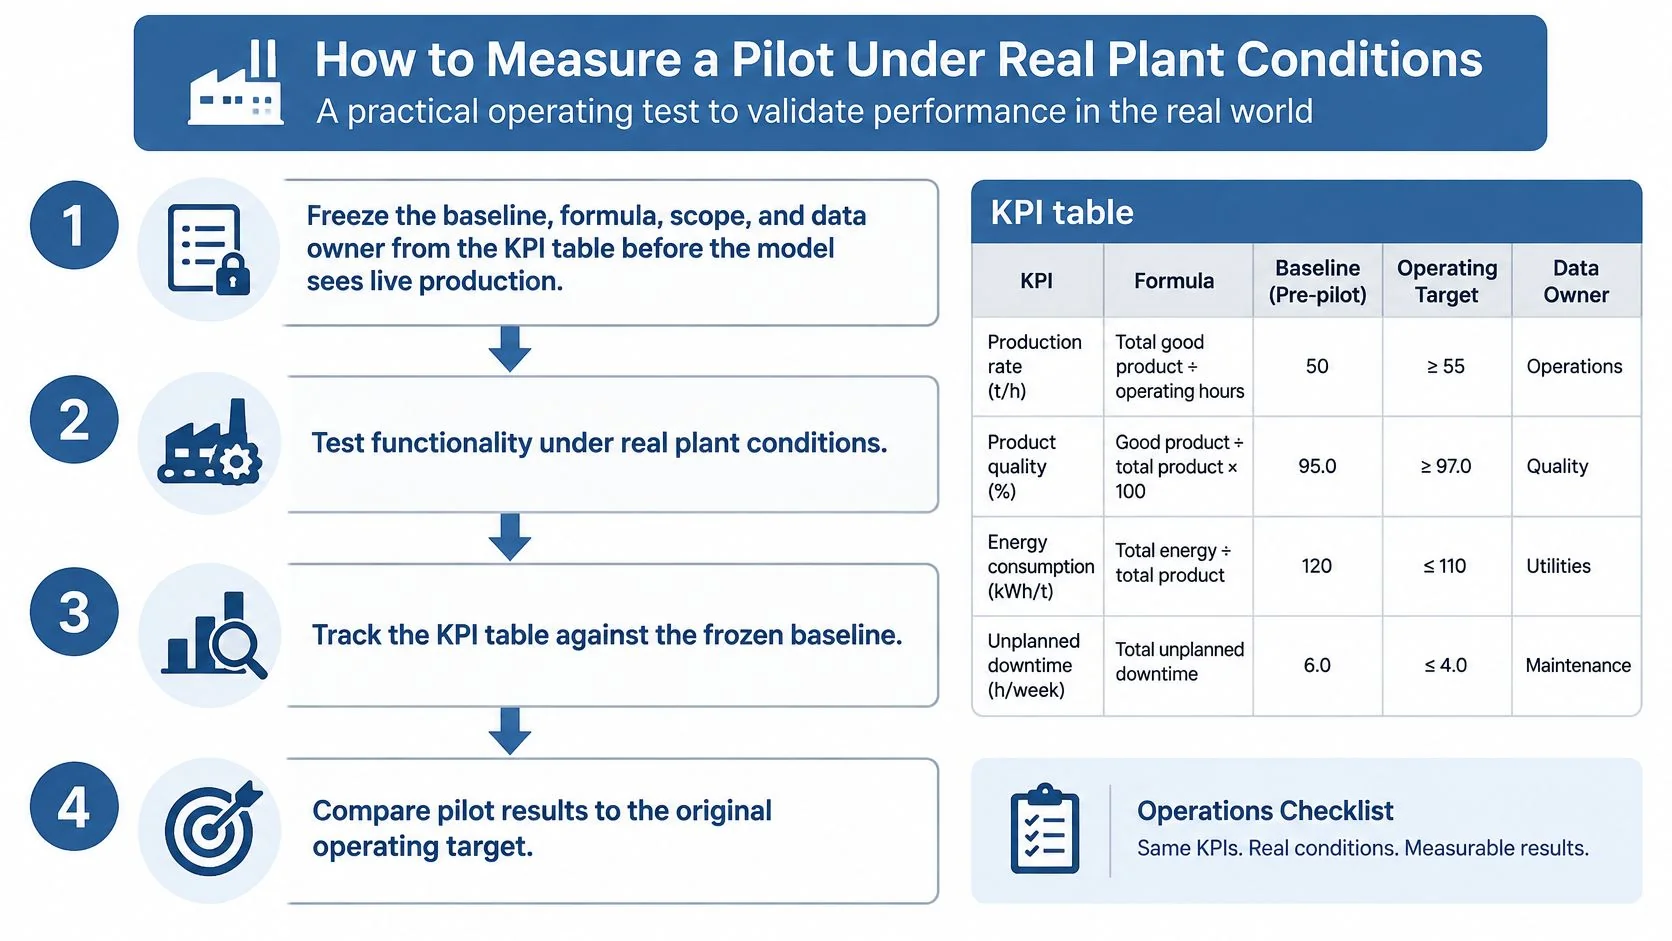
A pilot earns a scale decision only when its measures reflect production conditions and operational trade-offs. The NIST AI Risk Management Framework Playbook recommends documenting test sets, metrics, tools, uncertainty, and performance criteria under conditions similar to deployment. It also describes quantitative, qualitative, and mixed-method checks of system function, impacts, trustworthiness, and human-AI interaction.
-
Freeze the measurement basis. Before live production, set the baseline, KPI formula, product and line scope, measurement window, and data owner. A fixed basis prevents teams from changing the comparison after results arrive.
-
Test system function and risk. Assess performance before deployment and on a defined schedule during operation. Include operator interaction, known failure modes, and the operational consequences of errors.
-
Use representative production images for vision inspection. Include shifts, product variants, lighting conditions, and realistic defect frequencies. A curated development set may miss the conditions that cause false rejects or escaped defects on the line.
-
Compare predictive maintenance with current practice. Track false alarms per asset, missed-failure rate, warning lead time, and avoided downtime. Early warnings have little operational value if they miss failures or create more alerts than technicians can act on.
-
Document uncertainty and test conditions. Record the test set, metrics, validation tools, uncertainty, and how closely the test environment matches the plant. These details help distinguish improvement from temporary variation or selective reporting.
-
Reassess the measures in operation. After the first production window, check whether the KPIs still reflect the process. Record model errors and their effects, including whether operators override recommendations and why.
-
Hold the scale decision until both signals are acceptable. The target plant KPI must improve without worsening its guardrail. A strong initial accuracy score or projected payback does not compensate for a weaker operational outcome.
File a concise results note with the scope, baseline, evidence, limitations, errors, and decision. Include enough detail for another plant to audit the measurement and judge whether its operating conditions are comparable.
How Comparable Case Evidence Changes the Decision
A dashboard of model accuracy, alerts, or completed inspections can create false confidence if the plant's operating results remain flat. Before using a case study in a funding review, read it in a fixed order:
- Use case and production type: Identify what the AI does and whether the production setting resembles yours.
- Baseline and time window: Check what the result was compared with and how long performance was measured.
- KPI formula and denominator: Confirm what was counted, and how the reported rate or change was calculated.
- Evidence status: Determine whether the result is vendor-reported or independently checked.
- Original source: Follow the traceable link and read the underlying evidence where available.
A vendor-reported improvement without a baseline is weaker evidence than a smaller result that names the line, measurement period, and comparison. Evidence labels also matter: verified records have traceable sources, contributed records are reviewed before publication, and scraped records preserve a published claim but don't establish that it has been independently verified.
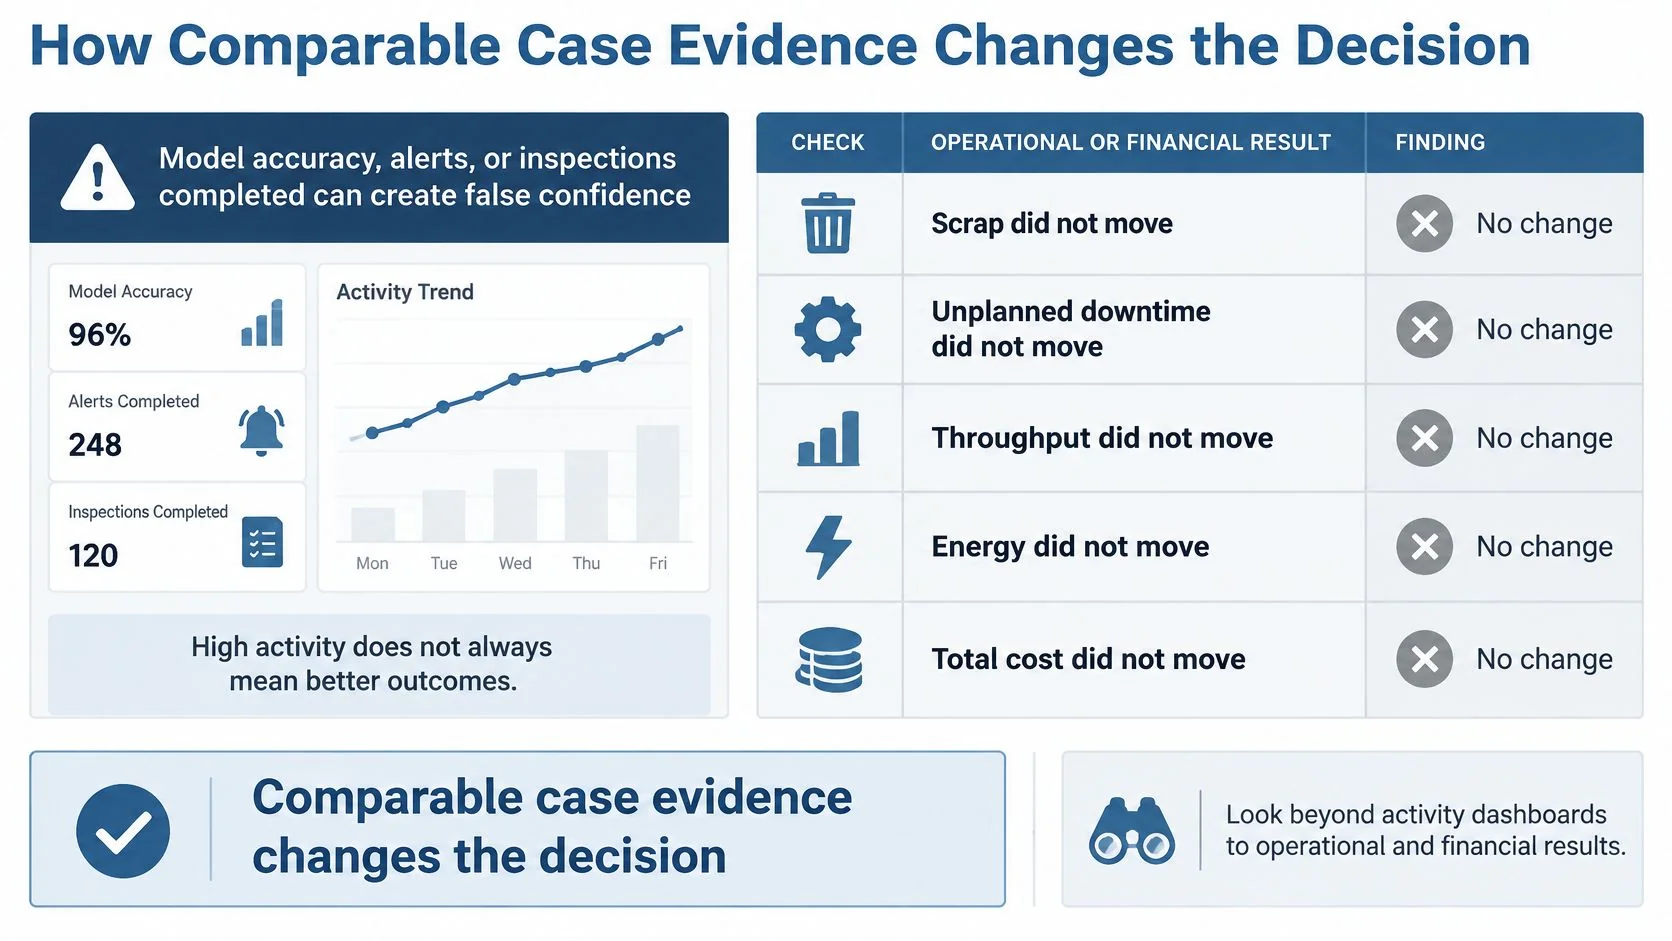
| Dashboard claim | Plant question to ask |
|---|---|
| Model accuracy improved | Did scrap move? |
| Alerts were generated | Did unplanned downtime move? |
| Inspections were completed | Did throughput move? |
| The system was deployed | Did energy use move? |
| The pilot met its activity target | Did total cost move? |
Filtering manufacturing AI case studies by industry, use case, and technology helps prevent a packaging-line vision system from being treated as proof for a process-industry maintenance model. Compare like with like, then use your plant's own locked baseline to decide whether the result is real.
External cases help define what to investigate and what results appear plausible. They don't replace local measurement. A close match can sharpen the pilot scope, but only evidence from the plant's own operating conditions can support its scale decision.
Decide Whether to Scale Modify or Stop
Scale only when the locked plant KPI improves within the agreed window, the guardrails hold, and checks for demand, staffing, production mix, and accounting changes pass. Modify when results hold only for a subset of operations or adoption is too low to trust a wider rollout. Stop when activity metrics look strong but the operating outcome stays flat, or when the financial claim disappears after implementation costs.
| Decision | Evidence required | Factory signal |
|---|---|---|
| Scale | Plant KPI improved in the agreed window; guardrails held; demand, staffing, mix, and accounting checks passed | Escapes or false rejects fall across shifts and variants |
| Modify | Gain holds on a subset of shifts, products, or assets; plant KPI mixed or adoption too low for wider rollout | Predictive maintenance catches failures on some assets but misses others |
| Stop | Activity metrics strong but operational outcome flat, or financial claim disappears after integration and training costs | Process control shows no change in throughput, scrap, or energy per good unit |
Apply the rule to the outcome that matters for each use case. A vision-inspection pilot should change escaped defects or false rejects, not merely report more completed inspections. A predictive-maintenance system should improve missed failures or avoided downtime, not just generate more alerts. Process control should move throughput, scrap, or energy per good unit, rather than win on an isolated model score.
Comparable published cases can show what similar plants measured and whether a claim was vendor-reported or independently checked. Before funding a second plant, search the AI for Manufacturing case database by industry, use case, and technology to find relevant implementations, then test the proposed result against that plant's own baseline.
Outcome measurement is how manufacturing teams decide which AI use case earns more line time and which remains a completed installation. For manufacturing AI, the scale decision should follow a verified operating result, a paired guardrail, and a financial claim that survives real plant costs.
