Manufacturing Quality Metrics a Practitioner's Guide
Master key manufacturing quality metrics like FPY, DPMO, and scrap rate. Learn how to calculate, benchmark, and use them to build the business case for AI.
Written by AI for Manufacturing
Most factories can tell you their First Pass Yield, scrap rate, and defect counts. Far fewer can prove what those numbers mean for warranty exposure, customer complaints, or profit. That gap is why manufacturing quality metrics often fail in practice. Teams measure quality, but they don't connect internal process performance to external business outcomes. The result is a dashboard full of movement and very little decision support.
That disconnect isn't a minor reporting issue. 60% of manufacturing leaders report difficulty quantifying the financial impact of quality improvements beyond simple defect reduction, which is exactly why quality programs often stall at the budget stage, as noted in this manufacturing KPI analysis. For anyone pursuing AI in manufacturing, that's the opportunity. AI isn't just another way to score defects. It's the missing layer that links shop-floor variation to cost, risk, and customer impact.
Table of Contents
- Defining Manufacturing Quality Metrics for the AI Era
- The Core Metrics and Their AI-Driven Data Sources
- Building the Data Pipeline from Shop Floor to Dashboard
- Setting Meaningful Benchmarks and Process Targets
- Connecting Process Quality to Financial Performance with AI
- Validating AI Outcomes with the AI for Manufacturing Database
Defining Manufacturing Quality Metrics for the AI Era
Manufacturing quality metrics are quantifiable measures used to track, monitor, and improve the quality of a production process and its outputs. They tell you whether the process is stable, whether the product meets specification, and whether defects are being prevented or merely discovered late. That definition is straightforward. The hard part is deciding which metrics deserve operational attention and which ones are just reporting residue.
In most plants, quality metrics are still treated as isolated scorecards. FPY sits in one dashboard, scrap in another, complaints in a customer system, and warranty data in finance or service. That's exactly why many teams can describe quality performance without being able to defend a quality investment.
For AI work, isolated metrics are weak inputs. Connected metrics are useful signals. If you're exploring AI quality control use cases in manufacturing, the question isn't whether you can collect more data. The question is whether you can connect process behavior, inspection outcomes, and downstream cost into one usable model.
Why the definition has changed
A decade ago, many quality programs were built to support audits, monthly reviews, and post-mortem analysis. That isn't enough now. AI systems need structured labels, event timing, traceability across systems, and a clear definition of success.
Practical rule: If a metric can't be tied to a decision, it won't improve operations and it won't train a useful AI model.
The strongest quality metric frameworks do three things at once:
- Describe process performance: They show whether the line is producing within expected quality boundaries.
- Expose business impact: They link defects, rework, and escapes to cost and customer outcomes.
- Create machine-readable targets: They provide labels and thresholds that AI systems can optimize against.
That's why the best manufacturing quality metrics programs aren't broader. They're tighter. They focus on the handful of indicators that connect factory behavior to business consequences.
The Core Metrics and Their AI-Driven Data Sources
A quality program doesn't need a long list. It needs a small set of metrics with reliable data sources and clear business meaning. The table below is the set I use most often when mapping AI opportunities in plants.
What belongs on the quality scorecard
| Metric | Calculation | AI-Relevant Data Sources |
|---|---|---|
| First Pass Yield | Units passing without rework ÷ Total units produced × 100 | MES, QMS, station test records, operator input |
| Process Capability Index Cpk | Calculated from process mean, standard deviation, and specification limits | SPC systems, inline metrology, LIMS, machine sensors |
| Scrap Rate | Scrap units ÷ Total units produced | MES, ERP, QMS, material tracking systems |
| Rework Rate | Reworked units ÷ Total units produced | MES, QMS, repair logs, operator terminals |
| Customer Complaint Rate | Count of customer complaints over a defined period | CRM, QMS, service systems |
| RMA volume | Count of returned units authorized for return | ERP, service systems, warranty systems |
| Cost of Poor Quality | Aggregated cost of scrap, rework, returns, warranty, and related failure costs | ERP, finance systems, MES, QMS, warranty systems |
First Pass Yield is still the anchor metric. It represents the percentage of units that meet quality standards without rework or repair in a single production pass, calculated as Units passing without rework divided by Total units produced multiplied by 100. In high-performing environments, top-tier factories consistently achieve FPY above 95%, while facilities below 85% are often flagged for immediate process intervention, and a 1% improvement in FPY can translate to millions of dollars in annual savings, according to Intely's manufacturing quality metrics overview.
That matters for AI because FPY is more than a KPI. It's a powerful label for supervised learning. If a unit passes the first time, the upstream process conditions become examples of acceptable production. If it fails, those same conditions become examples of risk.
Why these metrics matter to AI models
Different metrics play different roles inside an AI system.
- FPY works as an outcome label. Predictive quality models need to know what "good" looks like. FPY provides that signal at the unit, lot, line, or shift level.
- Cpk works as a process health constraint. A model shouldn't optimize throughput by pushing a process closer to the edge of spec without understanding capability.
- Scrap and rework show hidden factory cost. They often reveal process instability before customer complaints do.
- Complaints and RMAs connect internal defects to external failure. Without them, an AI system can look accurate on the line and irrelevant to the business.
- COPQ translates quality into financial language. That's what gets a plant manager and CFO aligned.
A common mistake is collecting vision data, machine telemetry, and test results without deciding which metric will be the primary target. That usually produces an impressive pilot and a weak deployment. If you're evaluating computer vision for manufacturing quality inspection, start by asking which quality metric the model will improve and which system records the ground truth.
Plants don't fail at AI because they lack data. They fail because the data isn't tied to a business-relevant quality outcome.
Another mistake is over-relying on customer-facing metrics. Complaint and return data matter, but they arrive late. They tell you what escaped, not what is about to escape. Internal process metrics are still necessary. They just can't be the final layer of the story.
Building the Data Pipeline from Shop Floor to Dashboard
Most quality dashboards look clean because someone cleaned the mess upstream. The essential work happens before the chart appears. If the data pipeline is weak, the KPI is decorative.
Where quality data really starts
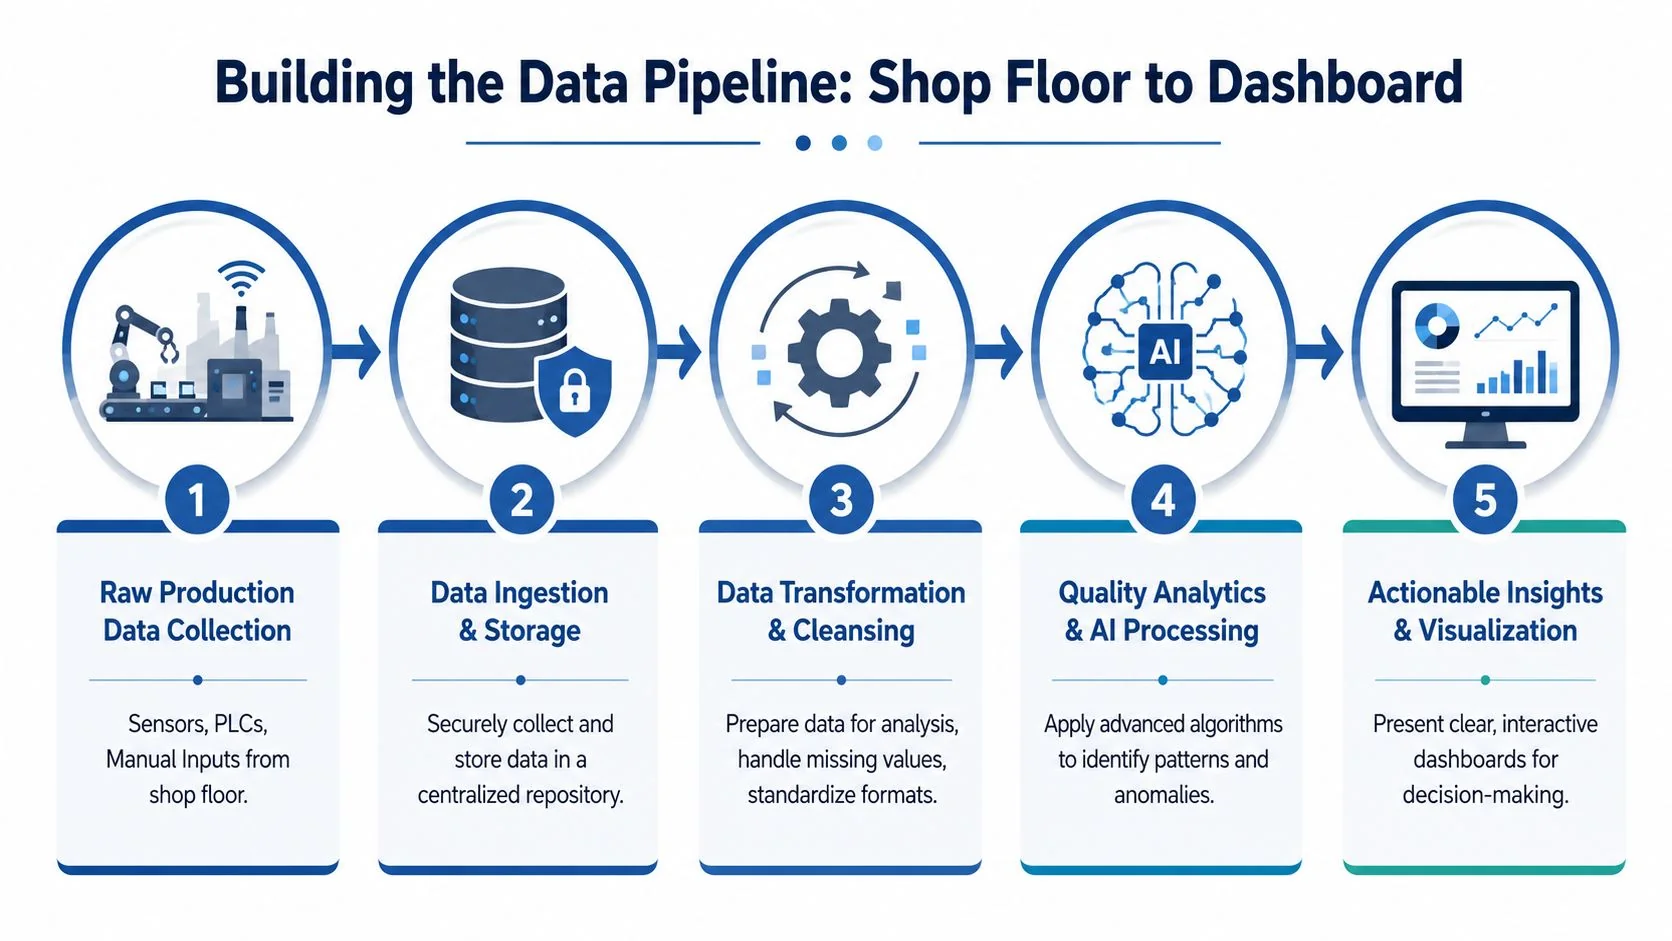
On the shop floor, quality data usually enters the system through a mix of machine events, sensors, PLC tags, vision systems, test stations, barcode scans, and manual operator entries. That's normal. What's not acceptable is leaving those streams disconnected.
A usable pipeline usually follows this sequence:
- Capture raw events: Collect machine states, measurements, test outcomes, lot IDs, and operator actions.
- Ingest into a common store: Move records from PLC historians, MES, QMS, and local devices into a centralized environment.
- Clean and align timestamps: Standardize units, resolve missing fields, and align product genealogy.
- Calculate quality metrics: Derive FPY, scrap, rework, process variation, and defect patterns.
- Trigger action: Surface alerts, root-cause clues, and decision support to engineers and supervisors.
Where AI adds value in the pipeline
The usual view is that AI starts after the dashboard. In practice, the best use cases start earlier.
- At ingestion: AI can flag abnormal sensor behavior before bad data pollutes the KPI.
- During transformation: Models can identify inconsistent operator coding, duplicate defect classes, and suspicious gaps in event history.
- At analytics time: AI can detect combinations of process conditions associated with failure, not just threshold breaches.
- At the action layer: It can rank likely causes, suggest checks, and prioritize interventions by estimated business effect.
What doesn't work is pouring noisy, unstructured records into a data lake and expecting a model to sort it out later. That approach usually breaks on traceability. If you can't tie a defect back to the unit, batch, machine state, and inspection point, you can't build a reliable quality model.
Field lesson: Clean lineage beats large volume. A smaller, traceable dataset is usually more valuable than a massive archive with weak context.
The practical design choice is simple. Build your data pipeline so every quality event has identity, timestamp, source system, and production context. Once that's in place, dashboards improve. Critically, AI becomes trustworthy enough to support intervention instead of just reporting.
Setting Meaningful Benchmarks and Process Targets
Benchmarking quality isn't about picking a number that sounds ambitious. It's about determining whether the process can reliably meet specification, and whether the target is worth optimizing.
Benchmarking starts with capability not aspiration
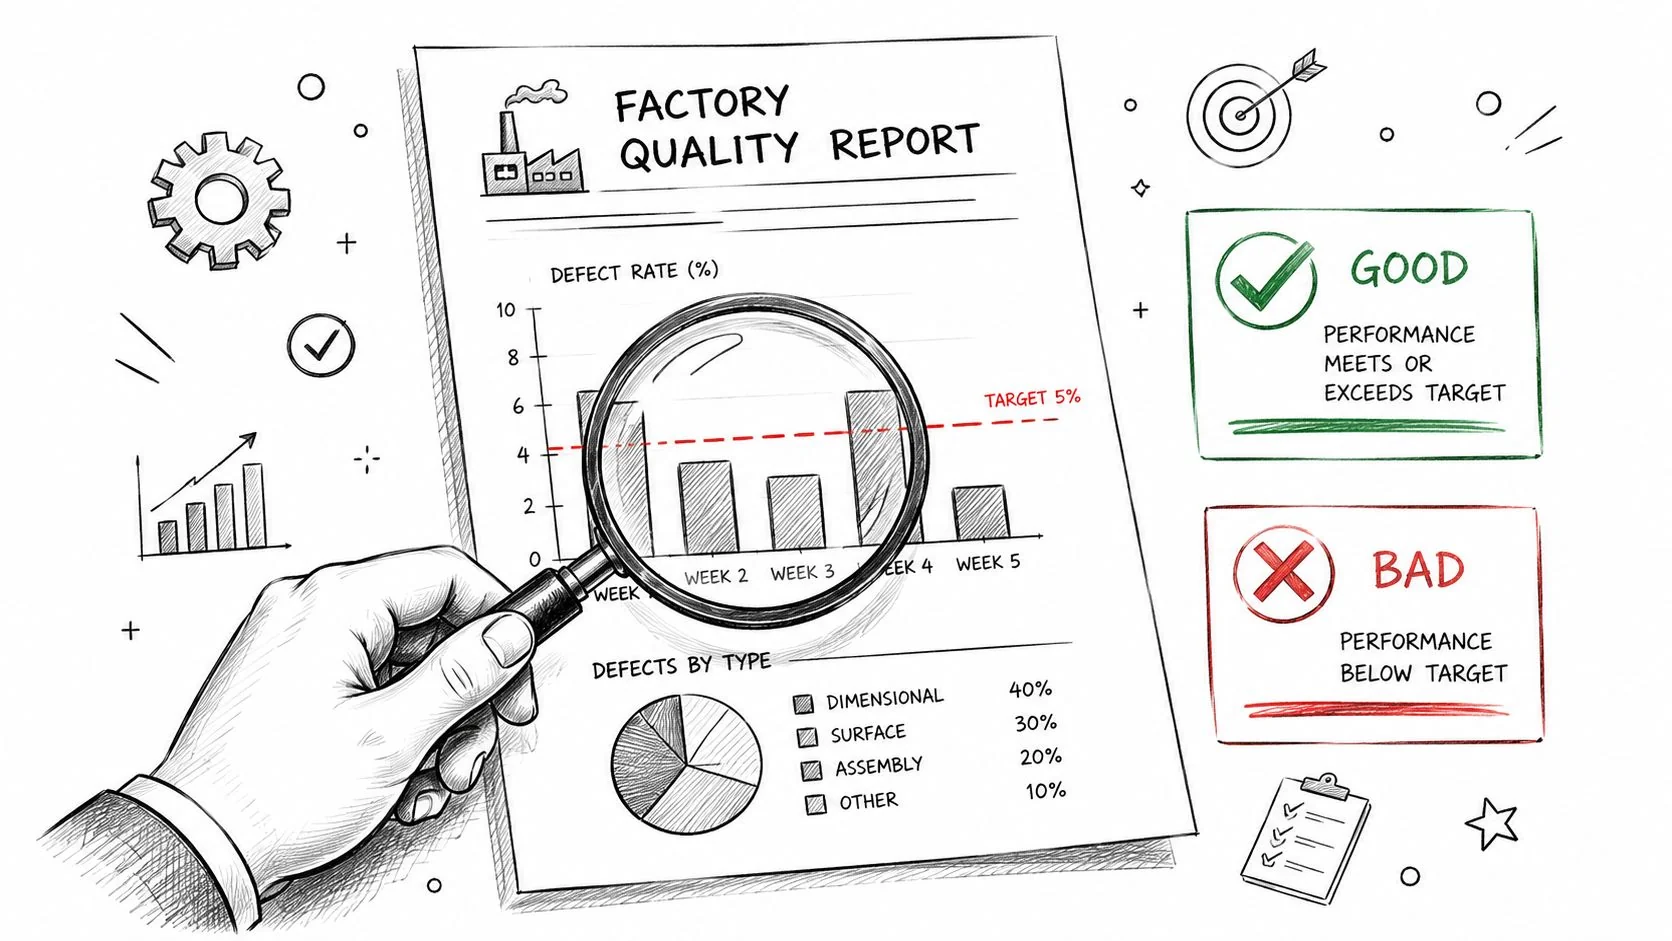
A process can post acceptable monthly yield and still be statistically fragile. That's why Process Capability Index, or Cpk, matters. A process reaches Six Sigma quality only when Cpk is 2.0, corresponding to 3.4 defects per million opportunities, while a Cpk below 1.33 indicates a high-risk process that directly inflates Cost of Poor Quality, according to Mestric's explanation of manufacturing quality parameters.
For AI work, this changes target selection. If a line has unstable capability, pushing an AI model to optimize output on that line may only automate volatility. You need to know whether the process is centered, whether the spread is under control, and whether the specifications are realistic.
The same source notes that operators should collect at least 30 data points to establish a statistically meaningful baseline before calculating Cpk. That's not a bureaucratic requirement. It's the minimum needed to avoid building decisions on bad estimates.
What good target setting looks like
A practical target-setting approach has three layers:
- Start with process capability: If Cpk is weak, stabilize the process before asking AI to optimize it.
- Set a plant-specific baseline: Use your own process history, not generic industry averages, to define what normal looks like.
- Choose one operational target and one business target: For example, improve FPY while reducing downstream warranty exposure.
The biggest error I see is teams using a benchmark without understanding process context. A benchmark can tell you where to look. It can't tell you what to fix.
Consider the trade-off. A line might hit a respectable yield by relying on inspection and rework. That looks acceptable in a monthly report. It looks terrible when labor, delay, and risk of escaped defects are added. Capability metrics expose that illusion.
A target is only useful if the process can physically support it and the business can feel the difference when it improves.
For someone pursuing AI in manufacturing, benchmarks aren't just performance markers. They're optimization boundaries. A model needs a valid target, a stable process, and a measurable outcome. Without those three, "improvement" is often just statistical noise with better graphics.
Connecting Process Quality to Financial Performance with AI
This is the point most quality dashboards miss. Internal process metrics and external financial outcomes are rarely modeled together, even though executives make funding decisions based on the latter.
Why traditional dashboards break the link
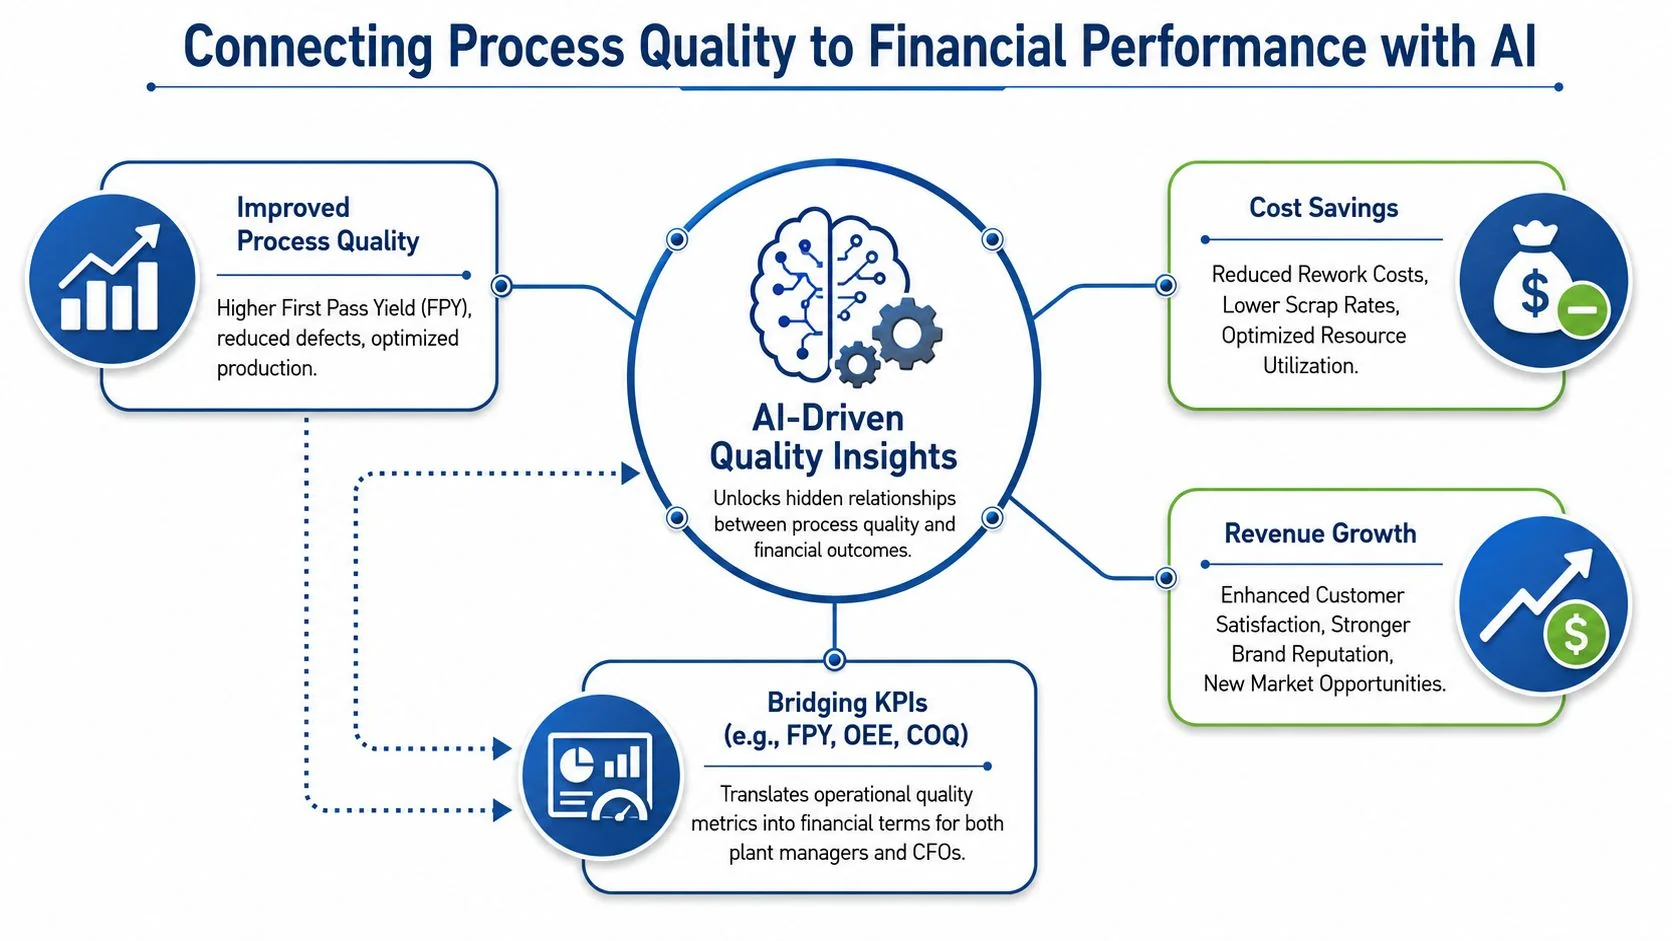
A plant manager sees FPY improve. Finance still sees warranty cost, service burden, and margin pressure. Both may be right. The missing piece is correlation across systems and time.
That gap is widespread. 60% of manufacturing leaders report difficulty quantifying the financial impact of quality improvements beyond simple defect reduction. They track process metrics like FPY but struggle to show how a 1% improvement correlates to a specific reduction in RMA volume or warranty costs, as described earlier. In this scenario, AI earns its keep.
How AI creates an ROI narrative finance will accept
AI can join MES history, QMS records, ERP cost data, service logs, and warranty events into one analytical layer. Once that structure exists, the model can do work a standard BI dashboard won't do well:
- Link process deviations to downstream failures: It can identify which line conditions, stations, or lots are associated with later complaints or returns.
- Estimate financial exposure: It can translate internal defect patterns into likely warranty, service, and rework risk.
- Prioritize corrective action: It can show which process improvement has the strongest probable business payoff.
- Support capital decisions: It gives operations leaders a way to justify sensors, vision systems, training, or process redesign with hard evidence.
This is the connective tissue most plants are missing. Without it, quality remains an operational discussion. With it, quality becomes a financial control system.
A useful operating model looks like this:
| Operational signal | AI correlation layer | Business outcome |
|---|---|---|
| FPY dip on a line | Match to lot genealogy, process states, and defect signatures | Increased risk of returns, rework, or warranty claims |
| Rising rework in a station | Compare with labor patterns, test data, and supplier inputs | Higher conversion cost and delayed shipments |
| Process drift within spec | Detect recurring patterns tied to later failures | Hidden COPQ and brand risk |
When quality metrics are tied to money, AI projects stop sounding experimental and start sounding necessary.
For anyone pursuing AI in manufacturing, this is the "so what." The goal isn't a more advanced defect chart. The goal is proving that better process control changes cost, customer outcomes, and profitability.
Validating AI Outcomes with the AI for Manufacturing Database
Many organizations don't need more AI theory. They need evidence from real factory deployments that resemble their own environment.
How to use the database like an operator not a browser
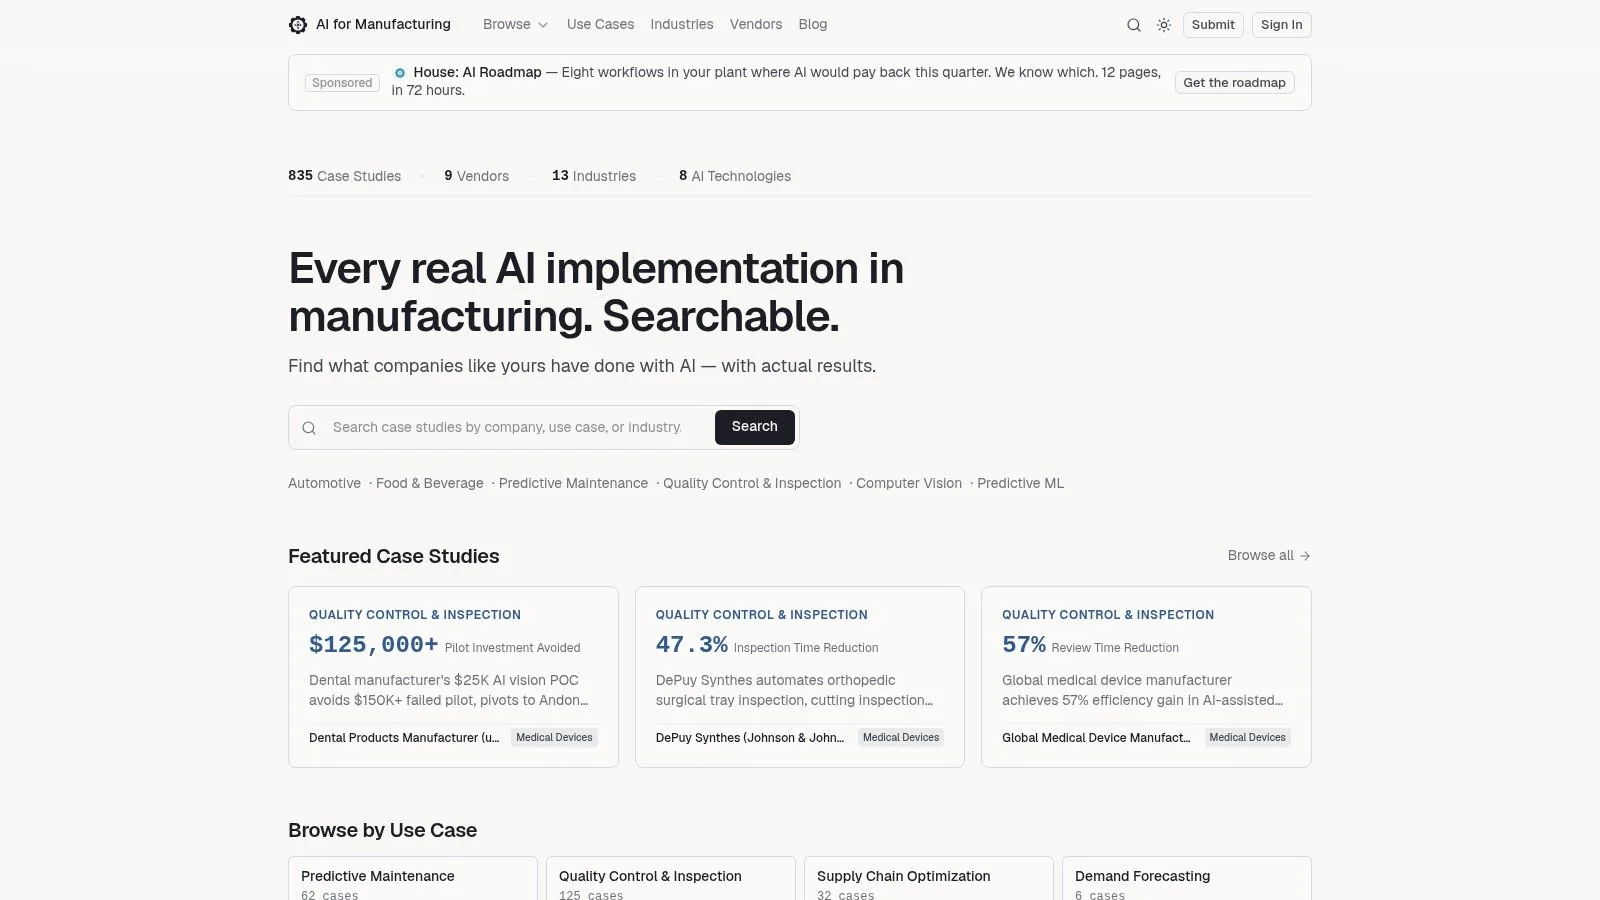
The practical move is to use the AI for Manufacturing case study database to narrow the field before you buy software, start a pilot, or promise savings. Filter for quality-related use cases, then look for implementations that improved the same category of metric you're trying to move. If your target is FPY, inspect cases that report yield improvement. If your issue is escapes or inspection bottlenecks, look for computer vision or anomaly detection deployments in similar production settings.
What matters isn't finding a perfect match. It's finding patterns:
- Which use cases repeat across industries
- Which technologies show up in quality control work
- Which metrics are reported after deployment
- Which source records are traceable enough to trust
This is how experienced teams de-risk AI initiatives. They don't start with a vendor demo. They start with evidence, operational fit, and measurable outcomes.
Manufacturing quality metrics matter because they tell you where process performance is drifting, where cost is accumulating, and where customer risk is being created. AI matters because it can connect those signals across MES, QMS, ERP, warranty, and service data in a way manual reporting rarely can. If you're building an AI roadmap for manufacturing, start with the quality metrics that operators trust, then use validated implementation evidence to identify where AI can improve both process control and business results.
