Manufacturing Predictive Maintenance: Your 2026 ROI Guide
Master manufacturing predictive maintenance. Implement PdM, measure KPIs, evaluate vendors, & achieve ROI with AI insights.
Written by AI for Manufacturing
Predictive maintenance is a condition-based maintenance approach that uses observed asset condition and a probabilistic forecast of Remaining Useful Life to determine when maintenance should occur, rather than relying on fixed intervals. In manufacturing, that matters because the financial upside is already large and measurable: the global predictive maintenance market reached $14.29 billion in 2025, manufacturing represented 30–32% of spending, and organizations adopting PdM have documented reductions in unplanned downtime of 30–50%, maintenance cost reductions of 18–25%, and average first-year ROI of 25–30% according to manufacturing predictive maintenance market data.
What is often underestimated isn't the model. It's the data gap. Many plants want AI-driven maintenance without years of clean failure history, yet 70% of mid-sized manufacturers don't have the 24+ months of data needed for initial model training, and 50% of PdM pilots fail in the first year due to insufficient training data according to analysis of the failure data cold start problem. That's why manufacturing predictive maintenance has to be designed as an operational program first and an AI project second.
Table of Contents
- The Business Case for Predictive Maintenance
- From Reactive to Predictive A Maintenance Strategy Comparison
- Anatomy of a PdM System Technology and Approaches
- Measuring What Matters Critical KPIs for PdM Success
- A Practical Implementation Roadmap for Manufacturers
- Vendor Selection and Verifying AI Claims
The Business Case for Predictive Maintenance
Predictive maintenance earns budget when it changes maintenance timing on assets that constrain production. The strongest cases are rarely the ones with the most sensors. They are the ones where one avoided failure prevents lost output, overtime labor, expedited parts, and schedule disruption in the same event.
For mid-sized manufacturers, the main obstacle is often not model selection. It is the failure data cold start. Many plants do not have three years of labeled breakdown history by asset, failure mode, and operating condition. They have work orders with vague text, missing root causes, and inconsistent asset naming. I have seen teams stall here because they assume PdM requires a clean archive of historical failures before they can start. In practice, that assumption kills good projects.
A workable business case does not require perfect history. It requires a target asset where early intervention has economic value, a signal you can measure reliably, and a maintenance response the team can execute. Start with equipment that has clear condition indicators and expensive downtime. Bearings, motors, pumps, gearboxes, compressors, and critical conveyors usually make better first candidates than complex assets with multiple interacting failure modes and weak instrumentation.
What the economics actually mean on the plant floor
The financial return comes from a small set of operational changes:
- Fewer surprise stoppages on constrained assets: Planned repair during a scheduled window costs less than a breakdown during peak production.
- Less wasted preventive work: Teams stop changing healthy components just because the calendar says to.
- Better labor allocation: Planners can schedule skilled technicians for known risks instead of pulling them into emergency work.
- Smarter spare parts decisions: Stores can stock parts for likely interventions instead of reacting to every urgent request.
Those gains only show up if the alert leads to action. A model that flags risk 6 hours before failure may be useful on one line and useless on another. The deciding factors are inspection lead time, part availability, maintenance access, and whether operations will release the machine. That is where many vendor ROI claims fall apart.
Practical rule: If the prediction does not change the work order, the schedule, or the shutdown plan, it is not a business case. It is an extra signal on a screen.
The cold-start issue changes how plants should frame early ROI. Year-one value often comes from detecting abnormal conditions and preventing a handful of high-cost events, not from a polished failure-prediction model across the whole site. Plants that accept that reality tend to move faster. They use technician findings, alarm history, inspection rounds, and process context to build enough labeled examples to improve over time.
Why it matters for AI in manufacturing
PdM remains one of the few AI use cases in manufacturing where the path from analytics to cash impact is traceable. A risk score can be tied to an inspection, a confirmed defect, a planned repair, and an avoided outage. That chain is visible to finance, operations, and maintenance. It is also why practical deployments get more traction than broad "AI platform" programs.
Real results come from treating PdM as an operating system for decisions, not a software install. Data collection, maintenance workflows, planner discipline, and operator response all have to line up. A good example is DuPont's 7x ROI in under a year with AI predictive maintenance, where value came from execution around the alerts, not just the analytics itself.
The plants that scale usually start with one question: where can earlier visibility change an expensive maintenance decision with the data we can collect now? That is the business case. The historical failure library can come later.
From Reactive to Predictive A Maintenance Strategy Comparison
Most plants don't jump straight into predictive maintenance. They carry a mix of strategies, often by asset class. That's normal. The problem starts when teams apply the same maintenance philosophy to everything, including assets where failure risk, downtime impact, and condition visibility are completely different.
Benchmark data shows that predictive maintenance can reduce unplanned downtime by 30–50% and reduce maintenance costs by 10–25% compared to reactive or preventive strategies according to predictive maintenance software benchmarks in manufacturing. For AI in manufacturing, this matters because it shows where data-driven methods outperform calendar-based routines and where they don't.
Maintenance Strategy Comparison
| Strategy | Maintenance Trigger | Cost Profile | Asset Uptime |
|---|---|---|---|
| Reactive | Breakdown or functional failure | Low planning cost, high disruption cost | Lowest on critical assets |
| Preventive | Fixed time or usage interval | Predictable labor, wasted part life on healthy assets | Better than reactive, but still inefficient on variable loads |
| Condition-Based | Threshold breach from observed condition | Better targeting than preventive, but often limited to simple alarm logic | Good where failure signals are clear and stable |
| Predictive | Forecast of future failure or Remaining Useful Life | Higher setup effort, better resource timing and fewer unnecessary interventions | Best fit for high-value critical assets with measurable precursors |
Where each strategy still makes sense
Reactive maintenance isn't automatically wrong. On low-cost, non-critical assets with no safety consequence and easy replacement, run-to-failure can be economically rational. Plants waste a lot of energy trying to make every asset “smart” when some assets don't deserve that attention.
Preventive maintenance is still useful where degradation is predictable enough and the task is cheap. But fixed-interval servicing gets expensive when operating conditions vary by shift, product mix, or operator behavior. You end up maintaining on the calendar instead of maintaining the machine.
Condition-based maintenance is often the bridge step. Teams monitor vibration, temperature, or current and trigger action when a threshold is crossed. That improves targeting, but threshold systems often miss subtle degradation patterns or generate alarms that don't consider load and operating context.
The practical maturity path is usually reactive on low-criticality assets, preventive on stable wear items, condition-based on visible degradation modes, and predictive on bottleneck equipment.
Why predictive changes the maintenance conversation
Predictive maintenance is formally distinct because the trigger isn't just current condition. It's the forecast. That changes planning. A threshold alert says something is wrong now. A predictive model says when intervention is likely to become necessary, which gives maintenance and operations a better chance to act during planned windows.
For manufacturing AI leaders, this matters because PdM isn't just another sensor layer. It's the point where analytics starts making timing decisions. Once that happens, the conversation shifts from “Are we monitoring the asset?” to “Can the plant trust the forecast enough to change work scheduling, technician allocation, and spare parts planning?” That's the threshold between pilot activity and real production value.
Anatomy of a PdM System Technology and Approaches
A workable manufacturing predictive maintenance stack has to do one thing well. It has to convert raw operating signals into maintenance actions the plant can trust. The technology sounds complex, but the architecture is usually straightforward when you break it into layers.
Predictive maintenance is formally a subset of condition-based maintenance where timing is determined by asset condition and a probabilistic forecast of Remaining Useful Life. It relies on fusing continuous condition signals such as vibration, temperature, and motor current with operating context to estimate actual equipment health according to this predictive maintenance technical reference. For anyone building AI in manufacturing, that definition matters because it separates real PdM from basic monitoring.
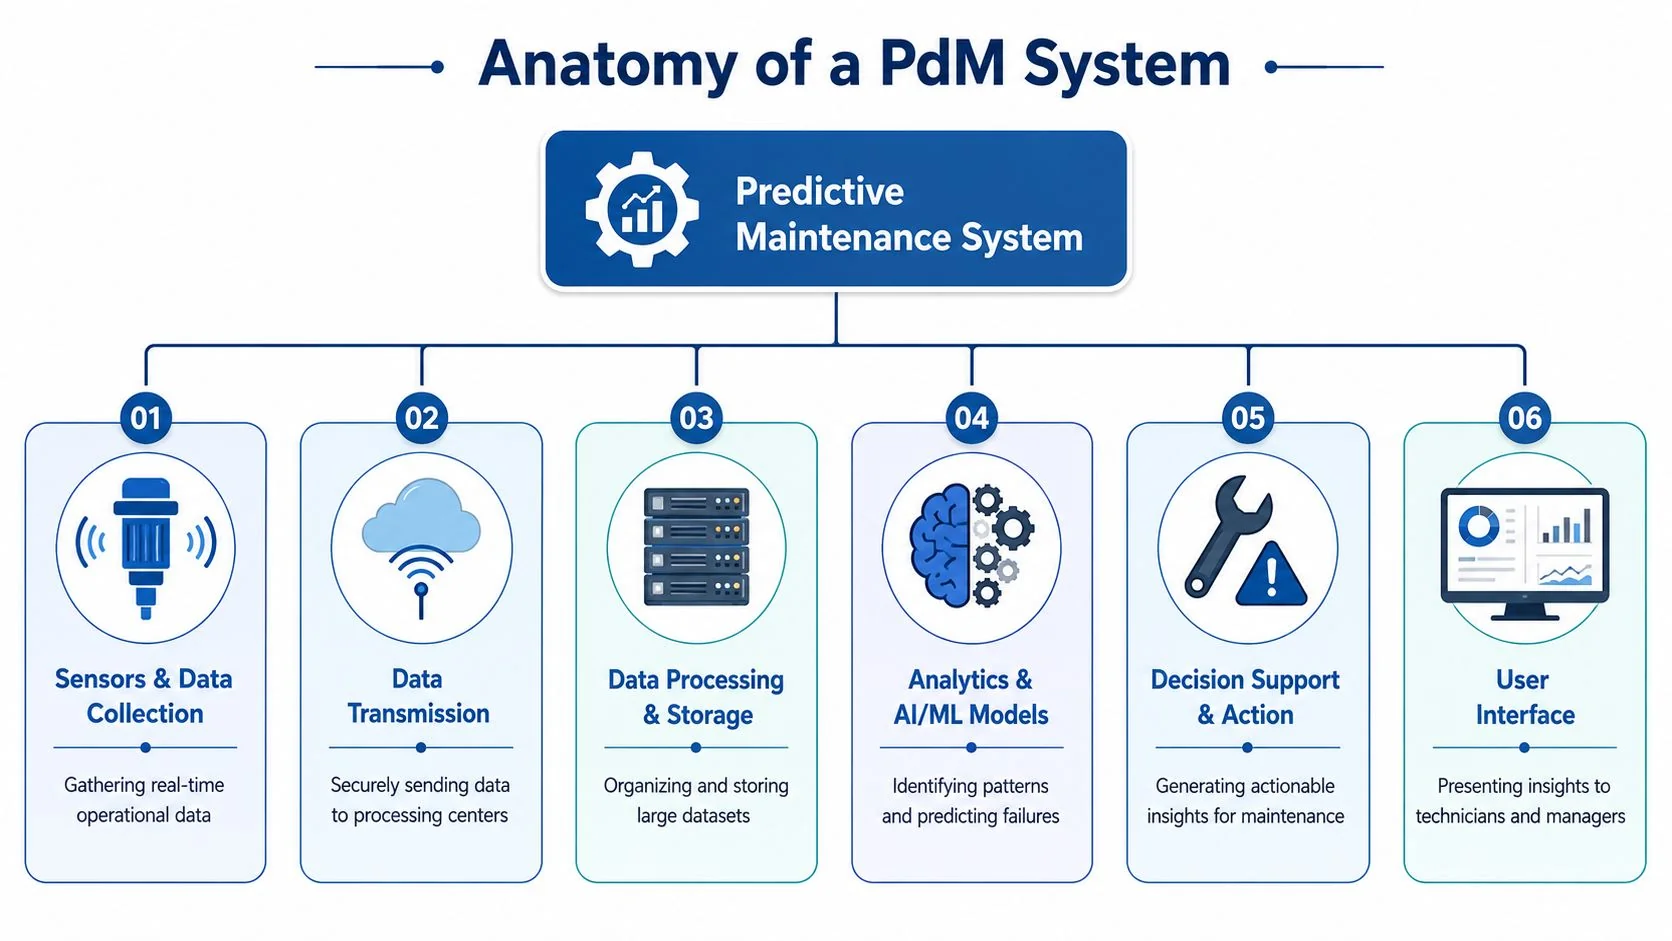
The six layers that actually matter
A PdM program usually includes these components:
-
Sensors and data collection
Vibration, temperature, and current are common starting signals because they often expose degradation before functional failure. The important question isn't “what sensors exist?” It's “which signal changes first for the failure mode we care about?” -
Transmission and edge handling
Data has to move reliably from machine to processing layer. In many plants, edge computing is not optional. It filters noise, handles intermittent connectivity, and preprocesses signals near the asset. -
Storage and context
Sensor data without run state, load condition, maintenance history, and asset identity creates weak models. Context turns a signal into a diagnosis candidate. -
Analytics layer In this layer, teams often lump everything together, but there are meaningful differences.
Three approaches that plants often confuse
Manufacturers regularly buy one of these and think they bought all three:
| Approach | What it does | Best use |
|---|---|---|
| Threshold monitoring | Flags when a measured value crosses a set limit | Simple, known failure indicators |
| Statistical or anomaly detection | Learns normal behavior and flags deviations | Limited failure labels, changing operating patterns |
| Predictive ML or RUL models | Estimates failure likelihood or remaining life | Critical assets where timing of intervention matters |
Thresholds are easy to deploy and useful for obvious issues. Statistical approaches help when the plant lacks labeled failures but has enough baseline operating data. True ML forecasting matters when maintenance timing needs to be optimized, not just triggered.
Don't let a vendor relabel threshold alarms as AI. If the system can't relate condition signals to future failure timing, it's monitoring, not predictive maintenance.
What works in real deployments
The strongest implementations are boring in the right way. They use a limited sensor set, clear asset selection, edge preprocessing where needed, and direct workflow integration. They also connect to existing plant systems instead of becoming an isolated dashboard. That integration work is usually harder than model selection, especially in plants with mixed controls environments and legacy historians. Teams planning for scale should think early about manufacturing system integration requirements, because the model isn't the only thing that has to fit.
For AI in manufacturing, this matters because success depends less on algorithm novelty than on whether the full chain from signal to action is reliable. If one layer breaks, trust in the whole program drops fast.
Measuring What Matters Critical KPIs for PdM Success
Most PdM programs don't fail because the plant lacks data science talent. They fail because nobody agrees on what success looks like. If leadership sees a dashboard, maintenance sees more alarms, and operations sees no change in uptime, the program loses support even when the model is technically sound.
The most critical KPIs for evaluating PdM business value are Overall Equipment Effectiveness, Predictive Accuracy, and ROI, while Planned Maintenance Percentage is a strong indicator of whether the program is becoming proactive according to maintenance KPI formulas for factories. That matters for AI in manufacturing because these metrics connect model performance to plant economics.
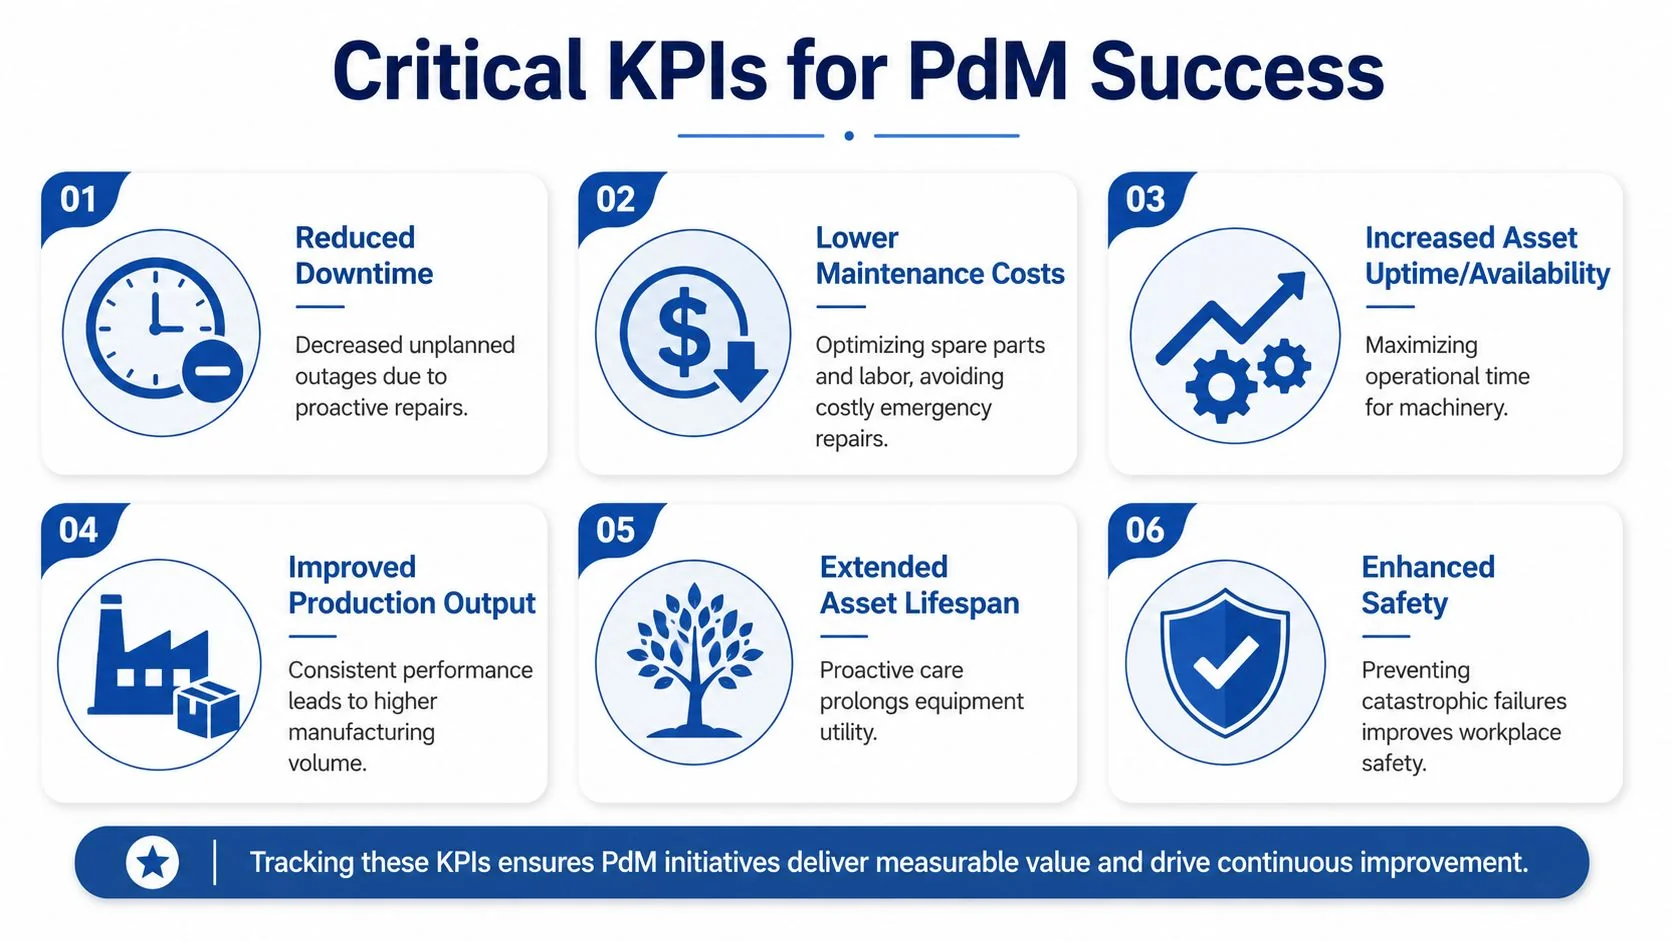
The KPI set that deserves executive attention
Here are the metrics worth putting on the same page.
| KPI | Formula | What it answers |
|---|---|---|
| OEE | Plant-specific OEE calculation | Is equipment effectiveness improving in a way production recognizes? |
| Predictive Accuracy | Detection Rate = (True Positives) / (Total Actual Failures) | Did the system catch real failures that mattered? |
| ROI | Financial return versus program cost | Is the program paying back in operational terms? |
| PMP | (Planned Maintenance Hours / Total Maintenance Hours) x 100 | Are we replacing emergency work with planned work? |
How to use each KPI without fooling yourself
OEE matters because production leaders care about throughput, availability, and quality. If PdM alerts increase maintenance activity but OEE doesn't improve, the program may be detecting issues that aren't constraining output.
Predictive Accuracy matters because many teams track alert counts instead of detection quality. High alert volume can hide weak performance. Detection Rate forces the question that matters: when failures occurred, how often did the system identify them in time?
ROI should include what changed operationally because of the prediction. A model that identifies degradation after operators already heard the bearing noise won't produce much business value. Savings only count when the alert changes maintenance timing, prevents disruption, or reduces labor and spare part waste.
The maintenance behavior metric most teams ignore
PMP is one of the best practical indicators of maturity. When Planned Maintenance Percentage rises, the plant is shifting work out of emergency mode. That shows PdM is affecting scheduling behavior, not just generating analytics.
A useful review rhythm is:
- Weekly: Validate alerts against technician findings.
- Monthly: Review OEE movement on monitored assets and any major false positives or misses.
- Quarterly: Recalculate ROI using actual work order outcomes, downtime avoidance records, and parts usage.
- After every significant miss: Check whether the issue was sensor coverage, operating context, threshold tuning, or maintenance workflow response.
If your KPI deck doesn't include both model quality and maintenance execution, you're only measuring half the system.
Why this matters for AI in manufacturing
AI initiatives in factories survive when operators, planners, reliability engineers, and finance leaders can all see their version of value. OEE speaks to production. Predictive Accuracy speaks to technical credibility. ROI speaks to leadership. PMP speaks to whether the organization is becoming more proactive. That's why KPI design is not a reporting exercise. It's the governance system that keeps manufacturing predictive maintenance tied to business outcomes.
A Practical Implementation Roadmap for Manufacturers
Plants do not fail at predictive maintenance because the models are weak. They fail because they start with too much scope and too little usable failure data.
That cold-start problem is common in mid-sized manufacturing. Asset histories are patchy, failure codes are inconsistent, and maintenance notes live in technician memory or free text. A practical roadmap starts there. The goal is to build enough signal, process discipline, and technician trust to support action on a small set of high-value assets, then expand with evidence.
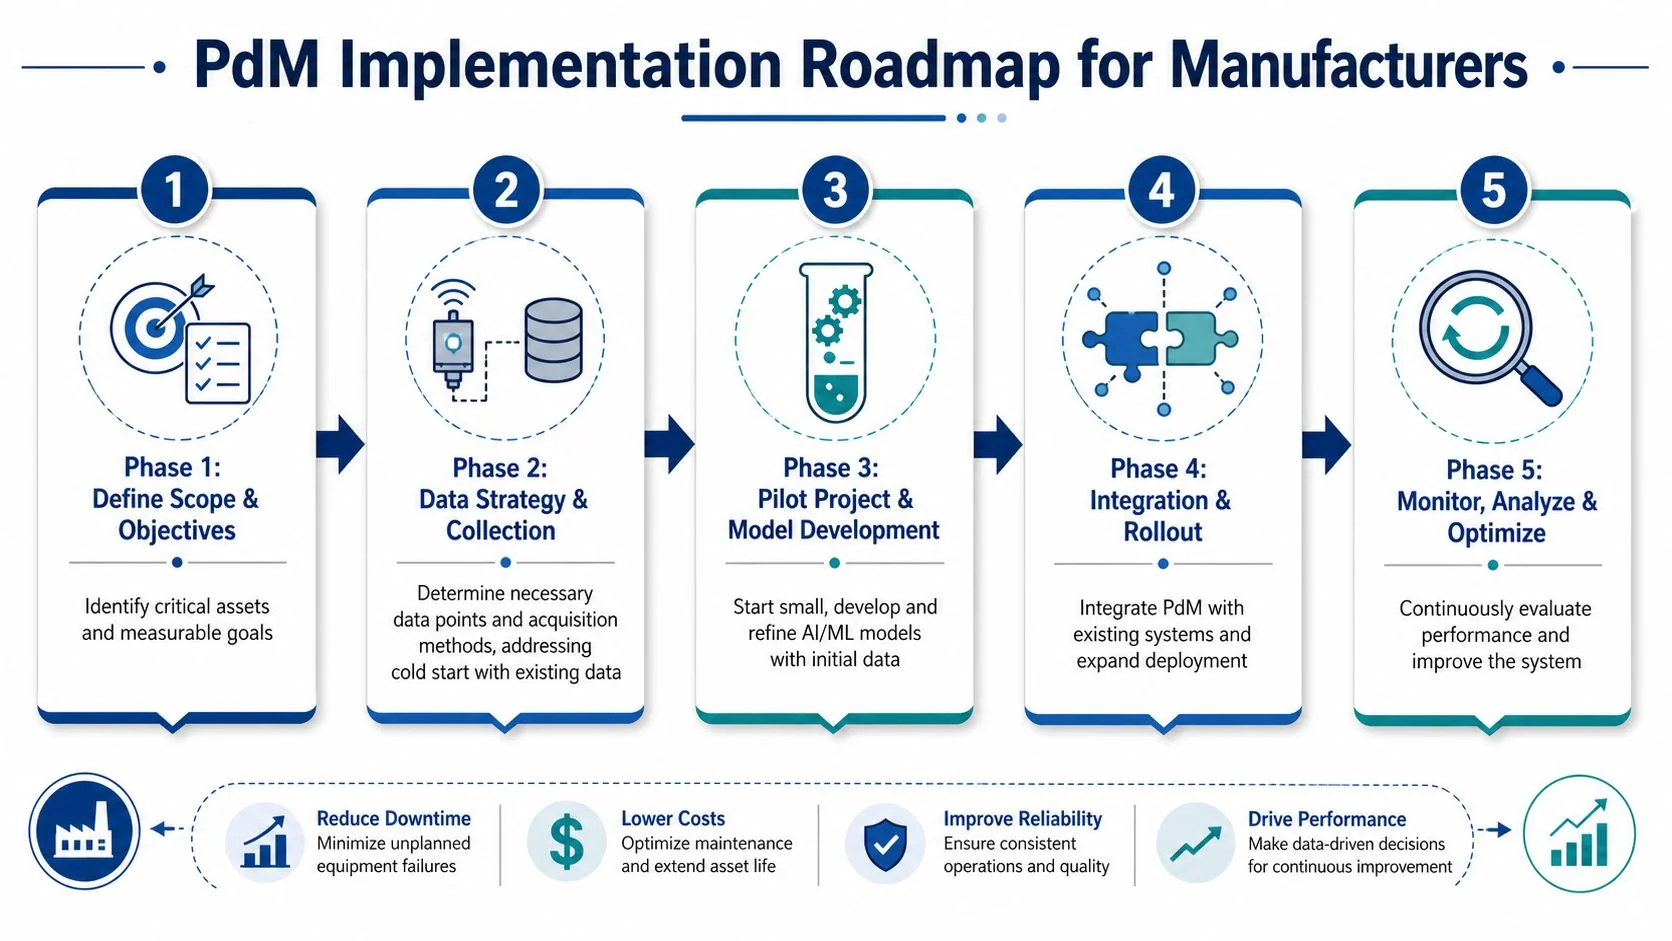
Phase 1 Define scope around failure economics
Start with the cost of failure, not the ease of instrumentation. The right pilot asset creates pain when it goes down, shows detectable degradation before failure, and has a maintenance response the plant can schedule.
A useful shortlist usually has four traits:
- Production dependency: The asset limits throughput, quality, or a constrained upstream process.
- Repeatable failure modes: The team has seen the same issue enough times to describe it, even if work order coding is messy.
- Measurable precursors: Vibration, temperature, current, pressure, or lubrication condition changes before the asset fails.
- Intervention window: Planners and technicians can act on a warning during an available maintenance window.
Define success in operating terms. Use avoided downtime, fewer emergency callouts, better-planned work orders, and shorter mean time to repair. A pilot that only proves the sensors can stream data is still a science project.
Phase 2 Build baseline data before chasing models
Cold-start plants need a baseline before they need AI. Handheld routes, temporary sensors, or limited continuous monitoring on a small pilot set often produce better early results than a plantwide rollout.
Use this period to capture three things cleanly:
- Normal operating signatures by asset and operating state.
- Failure mode mapping between technician observations and sensor behavior.
- Data hygiene rules for timestamps, asset names, work order references, and event labels.
The first real win is disciplined data capture tied to a known failure mode.
I have seen teams skip this step because a vendor promised automatic learning from raw historian data. The result is predictable. Alerts arrive without context, technicians lose confidence, and the pilot stalls before the first saved failure. Plants with limited history do better when reliability engineers and technicians review early findings together and agree on what a meaningful deviation looks like.
Phase 3 Choose the simplest model that supports action
Sparse labels call for simpler methods. Thresholds, anomaly detection, and rule-assisted condition monitoring are often the right starting point. They are easier to validate, easier to explain to technicians, and easier to tune against real findings.
Use model complexity only when the plant has earned it.
If the pilot focuses on bearings, imbalance, misalignment, or lubrication issues, early detection can work well after a baseline period. Remaining Useful Life estimates are harder. They need cleaner histories, more repeated failures, and tighter operating context than many plants have at the start.
A practical progression looks like this:
| Stage | Plant reality | Best-fit approach |
|---|---|---|
| No clean failure history | Sparse labels, inconsistent logs | Handheld monitoring plus baseline thresholds |
| Some stable baseline data | Normal-state behavior becoming clear | Anomaly detection with technician review |
| Repeated validated patterns | Reliable signal-to-failure mapping | ML classification or RUL forecasting |
For a real example of scaling from targeted monitoring into broader operating use, see this Colgate-Palmolive and Augury predictive maintenance case study.
Phase 4 Integrate alerts into CMMS workflow
Alerts have to become maintenance work. If they stay in a separate dashboard, adoption drops fast.
Route validated alerts into the CMMS or EAM with the asset ID, suspected failure mode, evidence from the signal, severity, and a recommended inspection or repair task. That gives planners something they can schedule and gives technicians enough context to verify the issue in the field.
The standard is straightforward:
- Complete context: A red icon is not enough. The alert needs probable cause and supporting evidence.
- Useful timing: The warning has to arrive early enough to plan labor, parts, and downtime.
- Closed-loop feedback: Technician findings, replaced parts, and inspection results need to feed back into the record.
If the team cannot trace an alert to a work order outcome, it cannot improve the program with confidence.
Phase 5 Scale by asset class, not by enthusiasm
Expand to similar assets first. That keeps the sensing strategy, failure logic, and maintenance response consistent across the next wave of deployment. It also makes training easier because technicians can apply what they learned on the pilot to comparable equipment.
Plants lose momentum when they jump from one good pilot to a long list of unrelated assets, sites, and failure modes. Integration work grows faster than value. So does confusion about what the system is detecting.
This phased roadmap fits plant reality. It gives manufacturers a way to build predictive maintenance with weak historical data, prove value on assets that matter, and increase coverage only after the workflow, data discipline, and response model are working.
Vendor Selection and Verifying AI Claims
Most vendors can demo a dashboard. Fewer can explain what data quality they require, how their models behave with sparse failure history, and how alerts enter maintenance workflows. That gap matters because manufacturing predictive maintenance only pays back when the operational details hold up after go-live.
While evaluating vendors, use realistic benchmarks. 27% of PdM adopters achieve full payback within 12 months, cloud pilots can reach payback in 12–18 months, and 68% of AI-mature manufacturers list PdM as a production deployment rather than a pilot according to AI predictive maintenance deployment and payback benchmarks. Those figures matter for AI in manufacturing because they give you a reality check when a sales team promises instant enterprise value.
Questions that expose weak vendors quickly
Ask these in plain language:
- Data readiness: What minimum history do you require, and what do you do in a cold-start plant?
- Failure mode scope: Which asset classes and failure modes are production-proven versus experimental?
- Workflow integration: How do alerts enter CMMS or EAM workflows, and what fields are passed through?
- Model transparency: Can the system show the signal basis for the alert and the confidence logic?
- Ownership and feedback: Who owns the data, labels, and retraining process?
A good vendor answers specifically. A weak one answers with architecture diagrams and general AI language.
How to verify claims before you commit
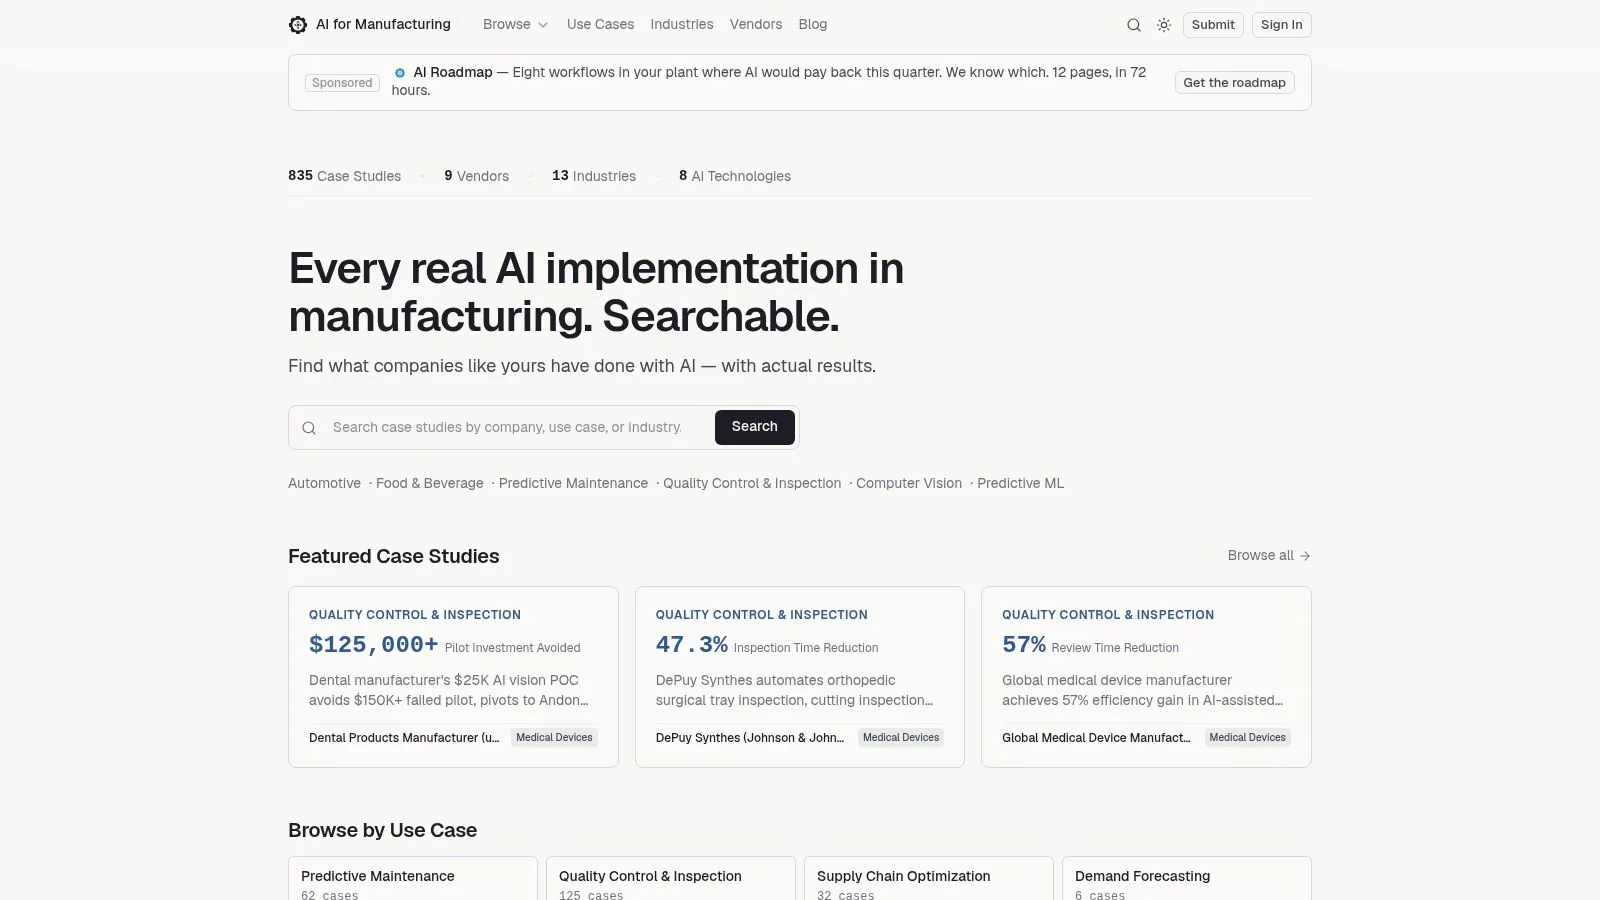
Cross-check vendor claims against documented implementations, not just presentations. Use evidence that shows the use case, industry context, technology category, and measured outcomes in a structured way. A practical starting point is to review documented predictive maintenance implementations such as Colgate-Palmolive and Augury and compare those records with what the vendor says they can deliver in your environment.
If a vendor can't explain where their model fails, they probably don't know where it works.
The reason this topic connects directly back to AI for manufacturing use cases is simple. Predictive maintenance is one of the few AI applications that forces every part of the manufacturing stack to work together: machine data, edge processing, model logic, CMMS integration, technician execution, and ROI tracking. Teams that learn to evaluate PdM with evidence and operational discipline get better at evaluating every other manufacturing AI use case as well. That's why it remains one of the most practical proving grounds for AI in manufacturing.
If you're evaluating where AI can pay back fastest in factory operations, the AI for Manufacturing database is a useful place to compare documented use cases, measured outcomes, and vendor-linked implementations across industrial settings.
