Manufacturing Data Analytics That Actually Scale
A practitioner's guide to manufacturing data analytics: architecture, KPIs, proven use cases, ROI benchmarks, implementation roadmap, and evaluation criteria.
Written by AI for Manufacturing
Manufacturing data analytics turns plant data into operational decisions, and the industrial analytics market is estimated at USD 36.64 billion in 2025, rising to USD 44.57 billion in 2026. The more useful figure for AI teams is that 63% of manufacturers analyze less than half of their manufacturing data, which points to use, not collection, as the bottleneck.
Manufacturing data analytics is the practice of collecting, structuring, and analyzing data from systems such as SCADA, MES, ERP, and industrial sensors to improve production, maintenance, quality, energy, and planning decisions. Common advice is to add more sensors, buy a broader dashboard platform, and then apply AI. On real plant floors, that sequence often produces more disconnected data, more disputed metrics, and another pilot that never reaches production.
The scalable path is narrower. First make existing data usable, then select workflow-embedded use cases with a clear operational owner, credible payback, and manageable governance burden. That approach gives AI models the conditions they need to produce decisions people can trust and act on.
Table of Contents
- What Manufacturing Data Analytics Really Means
- The Market and Why It Is Accelerating
- Data and Technical Architecture Explained
- Proven Use Cases and Measured Outcomes
- Your Implementation Roadmap and Best Practices
- Common Pitfalls and Barriers to Adoption
- Evaluating Options With Evidence-Based Research
What Manufacturing Data Analytics Really Means
Manufacturing data analytics combines data collection, preparation, analysis, and operational action. A useful program connects signals from machines and control systems with production context, quality records, maintenance history, inventory, orders, and planning information. The output shouldn't be another report that someone reviews after a shift. It should help a named person decide what to inspect, adjust, schedule, release, or stop.
The gap between available data and usable data is substantial. A 2026 survey of small and midsized U.S. manufacturers found that 46% rated their data and analytics use as manual or basic, with siloed systems and limited advanced analytics capabilities cited as constraints in the 2026 state of digital manufacturing report. A separate 2026 Manufacturing Leadership Council survey found that 63% of manufacturers analyze or use less than half of their manufacturing data, while only 42% have a process to verify data accuracy and quality.
Why data readiness blocks AI
An AI model can classify defects or forecast equipment failure, but it can't correct an undefined tag, a missing timestamp, or a maintenance record that uses different asset names across systems. Engineers then spend their time reconciling conflicting values instead of improving the model or embedding its output in a work instruction.
That makes data usability a prerequisite for AI, not an administrative task that follows model development. A plant pursuing computer vision, predictive maintenance, scheduling optimization, or process control should first answer four questions:
- Ownership: Which team owns each source and resolves quality issues?
- Meaning: What does each field, event, status, and calculation represent?
- Timing: Can records from different systems be aligned to the same production event?
- Action: Who will respond when the analytics output changes?
Practical rule: If operators and engineers can't agree on what a metric means, don't automate a decision based on it.
The roadmap is straightforward. Assess data readiness, define a standardized data product for one workflow, choose one high-confidence use case, establish metric governance, validate the business result, and only then expand across lines or sites. AI becomes more deployable when the plant treats data definitions and operating responses as part of the use case itself.
The Market and Why It Is Accelerating
The commercial case for manufacturing data analytics is expanding because factories are generating more operational information while facing greater pressure to improve reliability, quality, throughput, energy use, and planning. Mordor Intelligence estimates the industrial analytics market at USD 36.64 billion in 2025, increasing to USD 44.57 billion in 2026 and reaching USD 97.38 billion by 2031. The same market analysis implies a 16.92% CAGR from 2026 through 2031 in its industrial analytics market assessment.
That growth isn't a reason to approve a broad platform without a use-case thesis. The geographic pattern also matters for companies planning regional deployment. North America held 38.29% of the market in 2025, while Asia-Pacific is forecast to grow fastest, at a 17.96% CAGR through 2031, according to the same source.
More data doesn't automatically create more value
Data volume is where many platform conversations start. Automation World reported that IDC Insights expected a typical plant to generate more than 1 terabyte of data per day, with that volume likely to increase by 5x to 10x over the following five years, depending on the industry, as summarized in this manufacturing analytics statistics reference.
The same source gives an early view of which use cases led. IoT Analytics estimated the industrial AI and analytics market at USD 15 billion in 2019, with predictive maintenance leading use cases at 24.3%, followed by quality inspection and assurance at 20.5%, and manufacturing process optimization at 16.3%, as reported in the same source.
These figures help plant leaders benchmark their position, but they don't establish a universal investment sequence. A maintenance use case may be attractive at one site because failure records are reliable and the response process is mature. At another, quality analytics may be the better starting point because inspection outcomes are already structured and engineers can act on process-variable findings quickly.
The decision test is operational, not fashionable:
- Can the plant produce trustworthy inputs?
- Can the model output reach the person who acts?
- Can the business measure the result without changing the definition halfway through?
- Can the same pattern work in another line or site?
A large market and abundant telemetry create opportunity, not proof of readiness. Manufacturers that turn volume into standardized, decision-grade inputs will extract more value from AI than those that just collect more signals.
Data and Technical Architecture Explained
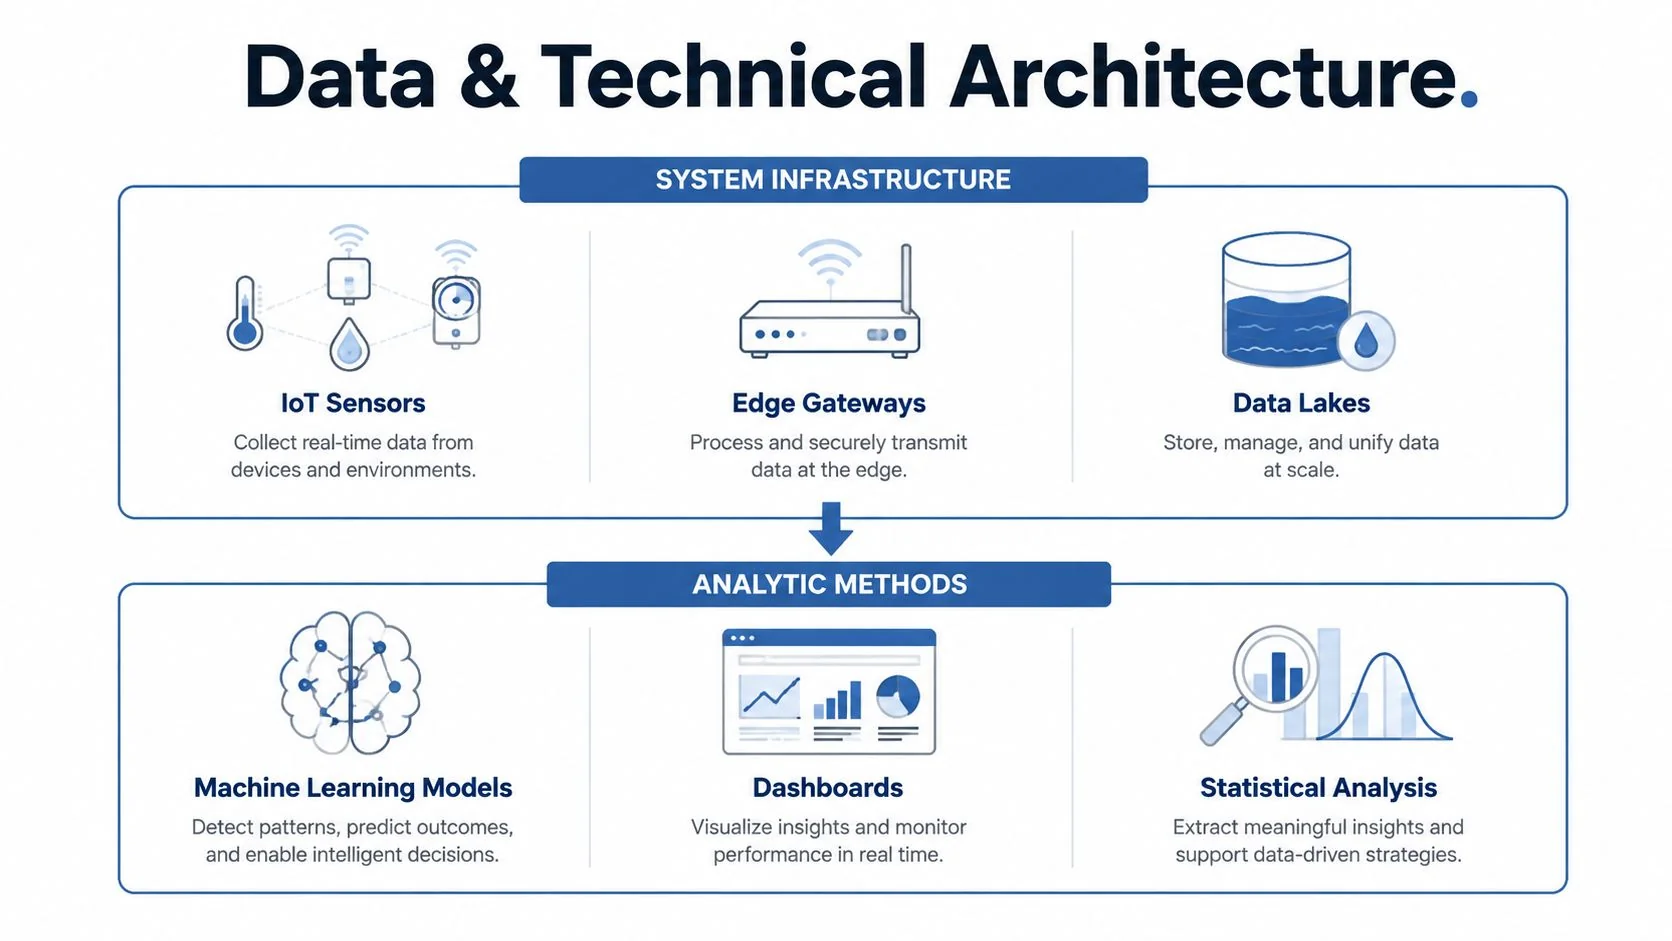
Manufacturing data analytics has two connected layers. System infrastructure makes data available, consistent, secure, and ready for analysis. Analytic methods use statistical techniques, machine learning, rules, or visualization to extract insight and support decisions. The distinction is central because an advanced model can't compensate for an infrastructure layer that loses context or changes definitions between systems.
A practical stack usually begins with several source types:
- SCADA: Process values, alarms, states, and equipment telemetry.
- OPC-connected systems: Standardized industrial interfaces that expose operational signals.
- MES: Production orders, operations, quantities, work-center events, and genealogy.
- ERP: Materials, purchasing, costs, customer orders, and planning context.
- Sensors and inspection systems: Condition, quality, environmental, and machine-specific measurements.
The integration challenge is heterogeneous data. A pressure signal may arrive at a different frequency from a temperature signal. MES may identify an asset by work center, while the maintenance system uses an equipment number. ERP may describe the same product with a commercial code rather than the manufacturing recipe. Without time alignment, asset mapping, and shared definitions, the analytical layer receives records that look complete but don't describe the same event.
Why ordinary OT interfaces can be enough
A predictive-maintenance study used about 44,000 timestamped observations collected from July to November 2023 through SCADA and OPC-connected systems. The dataset included pressure and temperature signals from the hot and cold sides of exchangers, which suggests that standard OT interfaces can support failure forecasting and anomaly detection without exotic instrumentation, as described in the industrial sensor analytics study.
The practical qualification matters more than the observation count. The model's usefulness depends on clean integration across plant data streams and enough historical coverage to capture degradation patterns. A plant shouldn't buy new instrumentation until it has checked whether existing signals are accessible, time-aligned, and connected to known outcomes.
A standardized data product gives the analytical layer a stable contract. It defines the schema, calculations, naming, quality rules, and operating expectations once, so maintenance, scheduling, quality management, and AI applications use the same meaning. A dashboard displays a number. Analytics requires agreement on what that number means, how it's calculated, when it's valid, and what action it should trigger. The enterprise AI architecture guidance is useful when those requirements extend beyond a single application.
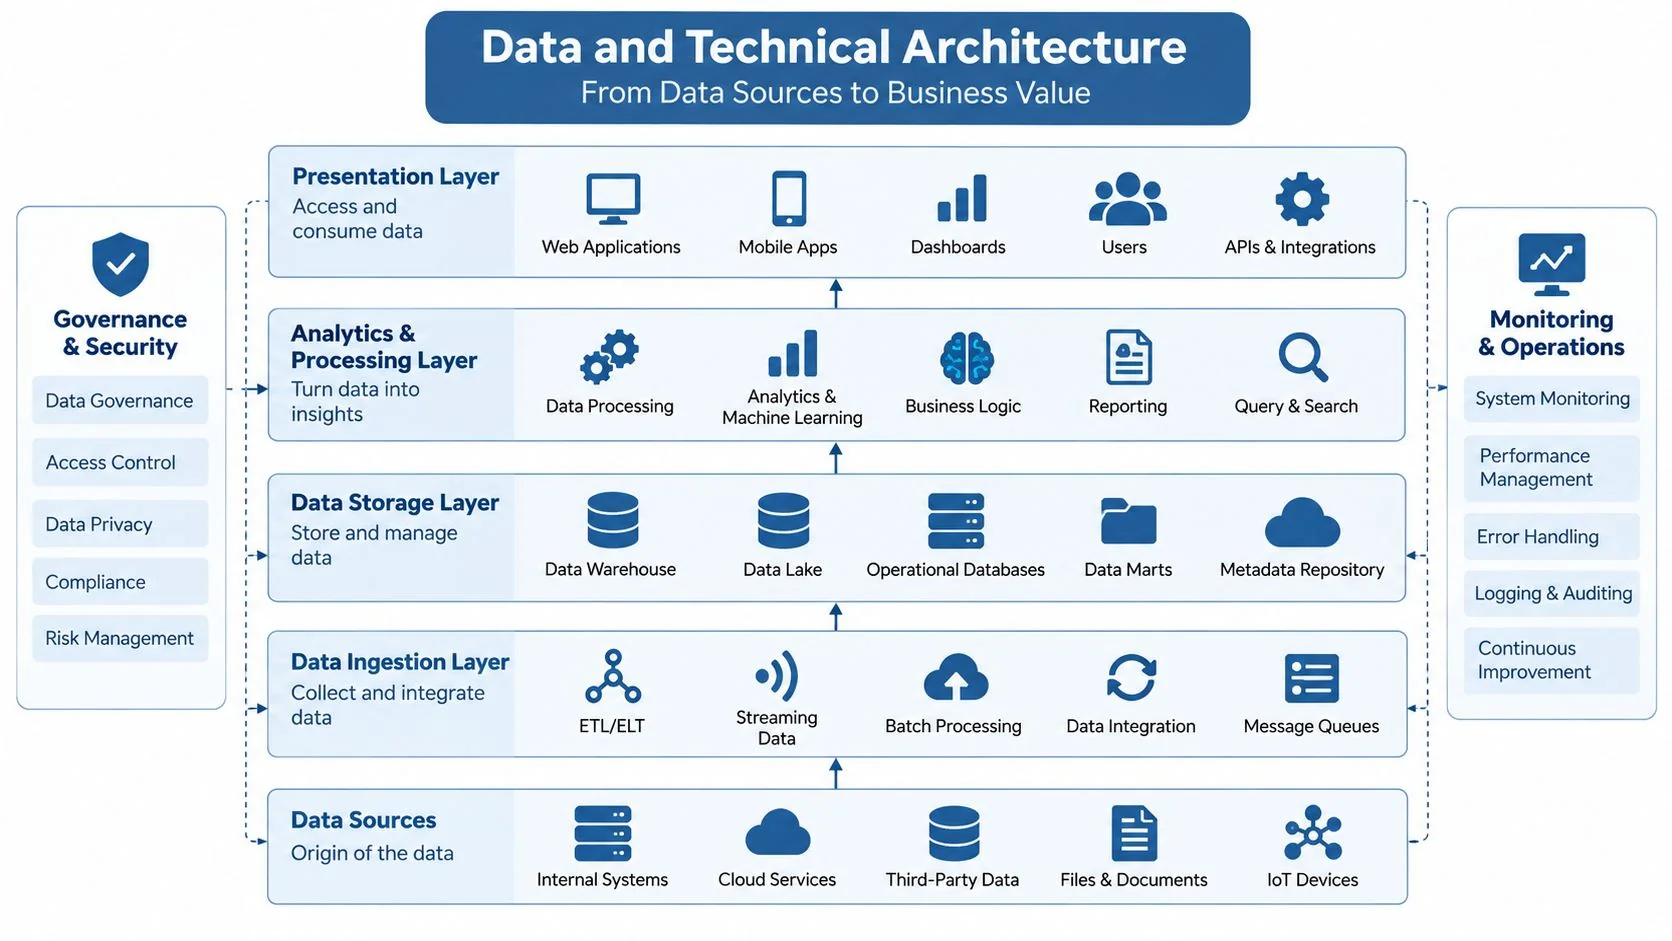
A minimum viable analytics stack therefore includes accessible source data, an integration layer, governed definitions, quality checks, storage suited to the workload, an analytical method, and a workflow interface. It doesn't require a plant-wide digital replica on day one. For AI, the best first architecture is the smallest one that produces a trustworthy output and places that output inside an existing operating process.
Proven Use Cases and Measured Outcomes
Analytics earns a place on the plant floor when it connects a measurable problem with a repeatable response. Predictive maintenance can flag equipment risk early enough for planners to schedule an intervention. Quality analytics can identify process conditions associated with variation. Energy analytics helps teams find avoidable consumption, while demand forecasting connects commercial signals with production planning.
A machining quality case shows the practical value of explainability. Analytics converted raw machining data into feature-importance rankings for quality outcomes, helping engineers identify the process variables with the greatest influence instead of tuning every input through trial and error. The machining quality-improvement case study shows how feature attribution narrows the root-cause search and helps engineers stabilize parameters faster.
Feature importance still does not prove causation. Process engineers need domain knowledge, controlled validation, and safeguards before changing a recipe or control limit. The model's useful role is prioritization. It indicates where to investigate first, while production and quality owners decide whether the relationship is safe and actionable.
ROI benchmarks need an evidence label
A manufacturing-AI ROI benchmark reports an average of about 200% ROI across deployed use cases, with the ranges below reported as three-year benchmarks in the manufacturing AI ROI analysis.
| Use Case | Three-Year ROI Range | Primary KPIs Affected |
|---|---|---|
| Predictive maintenance | 400%–500% | Unplanned downtime, maintenance cost, asset availability |
| Computer-vision quality inspection | 250%–350% | Defect detection, scrap, rework, quality escapes |
| Energy optimization | 300%–400% | Energy consumption, production cost, emissions-related measures |
| Demand forecasting | 200%–300% | Inventory, schedule stability, stockouts, overproduction |
Treat these figures as planning references, not promises. Before using them in a business case, check whether the result is vendor-reported, independently verified, or based on conditions unlike your plant. Define the baseline, implementation cost, response behavior, downtime accounting, and measurement period before deployment. Otherwise, a team can claim ROI from alerts that nobody used.
The fastest path from signal to action should guide the first project. Predictive maintenance implementations in manufacturing (see examples here) are a practical fit where work orders and failure modes are structured. Quality analytics is compelling where inspection data is consistent and process engineers can test findings. Energy optimization requires trustworthy meter allocation and operating context. Demand forecasting belongs with planning teams that can change schedules or inventory policies based on the forecast.
The right first business case is the one where the plant can prove that better data changed a decision and that the decision improved a defined operational outcome. That proof depends on usable data, clear ownership, and a response embedded in daily work.
Your Implementation Roadmap and Best Practices
A scalable manufacturing data analytics program starts with a workflow, not a platform. Select a problem that has a clear owner, an existing operating response, and a result the plant already knows how to measure. Then build only the data path required for that problem.
A use-case-first sequence
Assess readiness before modeling. Map the source systems, asset identifiers, timestamps, outcome labels, data gaps, and current decision process. Include operators, maintenance planners, quality engineers, IT, and finance. Each group sees a different failure mode, and the model will inherit any unresolved ambiguity.
Choose one high-confidence pilot. Prioritize by payback speed, deployability, data completeness, and governance burden. A narrowly scoped anomaly-detection workflow that maintenance planners can use may be more valuable than a broad optimization program that needs every plant system integrated.
Define the result before deployment. Specify the baseline, target KPI, alert recipient, response window, escalation rule, and criteria for stopping the pilot. If the team can't explain what happens after an alert, the use case isn't operationally ready.
Govern the metric contract. Assign ownership for each metric, document calculation rules, control access, and record changes to definitions or source logic. The manufacturing data collection guide can support the source-mapping stage, but governance must remain a plant operating responsibility.
Scale the proven pattern. Replicate the data product and workflow only after the first site demonstrates stable data quality, user adoption, and a credible business result. Multi-site rollout should preserve the core meaning of the metric while allowing local differences in equipment, process, and regulatory requirements.
A published manufacturing analytics governance paper sets minimum quality thresholds of 95% OEE data completeness, 98% quality-metric accuracy, and 90% energy-data availability, as documented in this manufacturing analytics governance research. These thresholds aren't universal acceptance criteria, but they show the level of explicitness required when plant leaders want trustworthy decisions.
A dashboard alone doesn't satisfy this roadmap. It can display OEE, yield, or energy use while different teams calculate those measures differently. Analytics begins when the plant agrees on the number's definition, validates its inputs, controls changes, and embeds the result in a decision.
Common Pitfalls and Barriers to Adoption
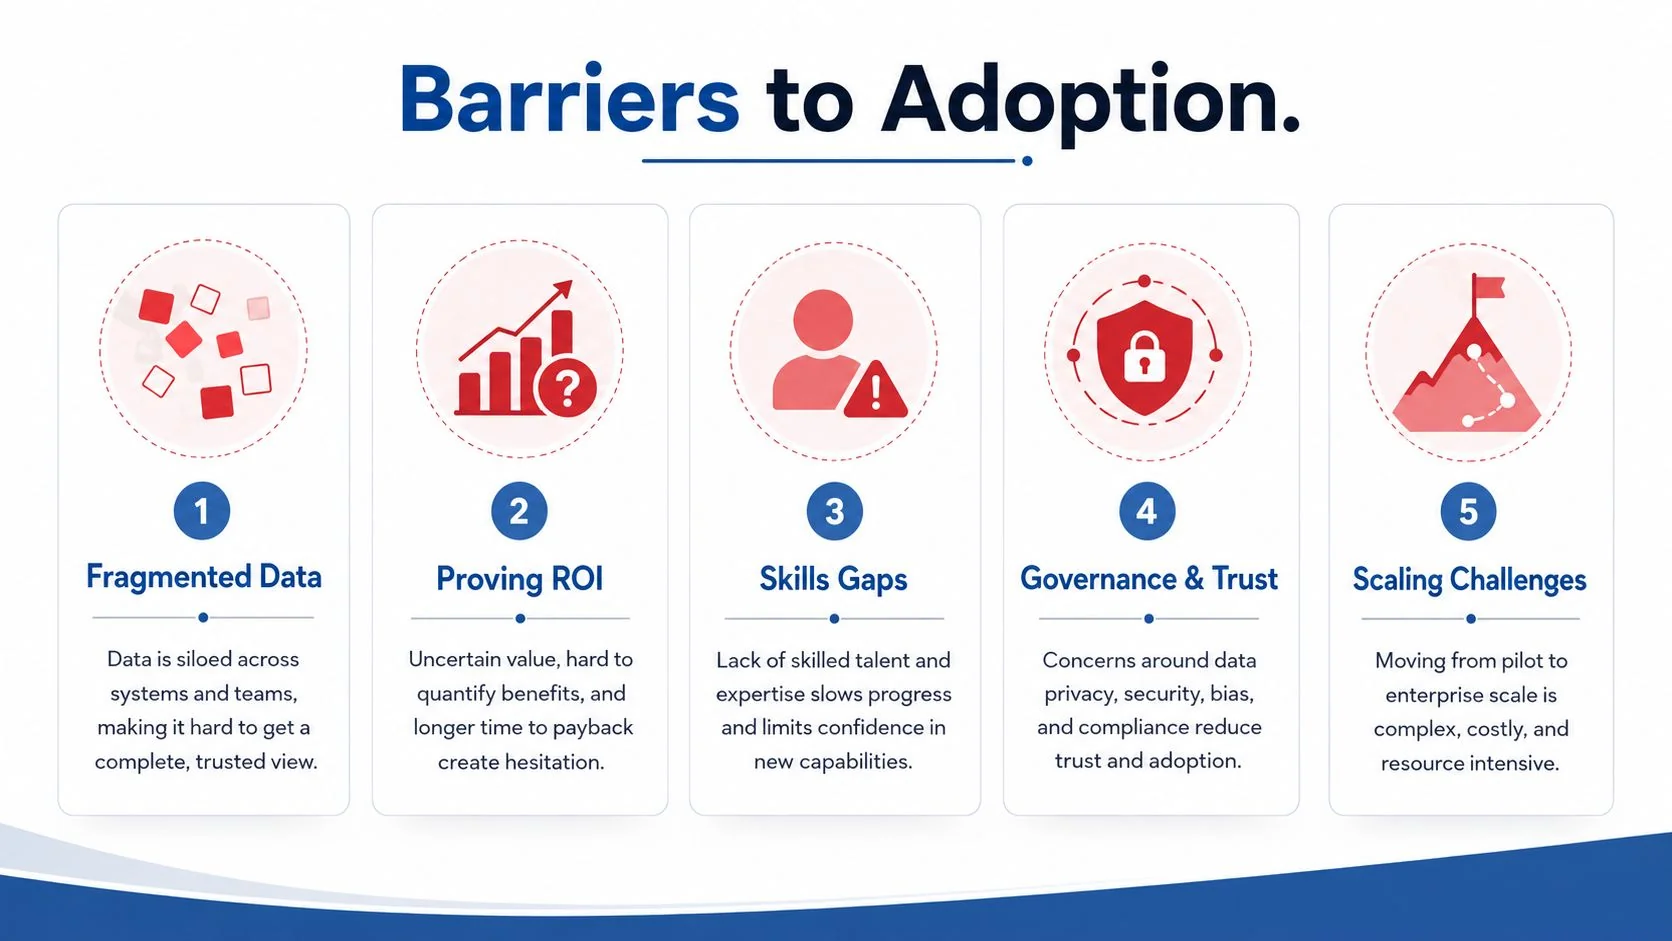
Analytics pilots fail when the plant cannot prove business value, connect results to legacy workflows, or earn enough operator trust for the output to influence work, rarely because a team cannot train a model. Verdantix identifies five recurring barriers to industrial AI analytics adoption: poor and fragmented data, difficulty demonstrating ROI, skills and capability gaps, governance and trust concerns, and scaling beyond proof-of-concept in complex legacy environments, summarized in this manufacturing analytics adoption analysis.
The warning signs appear early
Risk shows up before deployment. Maintenance, quality, and operations may use different asset names for the same machine. A dashboard may have no named owner, a metric may change without a record, or data engineering may treat missing values as a technical nuisance instead of an operating problem.
Procurement caution reinforces the point. A 2025 DNB survey found that 22% of procurement leaders cited insufficient data quality as a major obstacle, while 23% cited uncertainty over AI adoption, according to the DNB manufacturing procurement findings. These concerns shape funding, supplier evaluation, and the willingness of plant teams to move from experimentation into production.
Each barrier needs a specific response:
- Fragmented data: Choose one governed workflow first. Map identifiers across its source systems before adding more feeds.
- Unproven ROI: Set a baseline and connect the KPI to a response. Model accuracy is not business value unless someone acts on the result.
- Skills gaps: Pair data specialists with process owners who understand failure modes, inspection practice, and safe operating limits.
- Governance and trust: Publish definitions, validation results, ownership, access rules, and model-change procedures where users can inspect them.
- Scaling challenges: Package the data product, deployment process, and operating response so another site can reproduce the approach without rebuilding it.
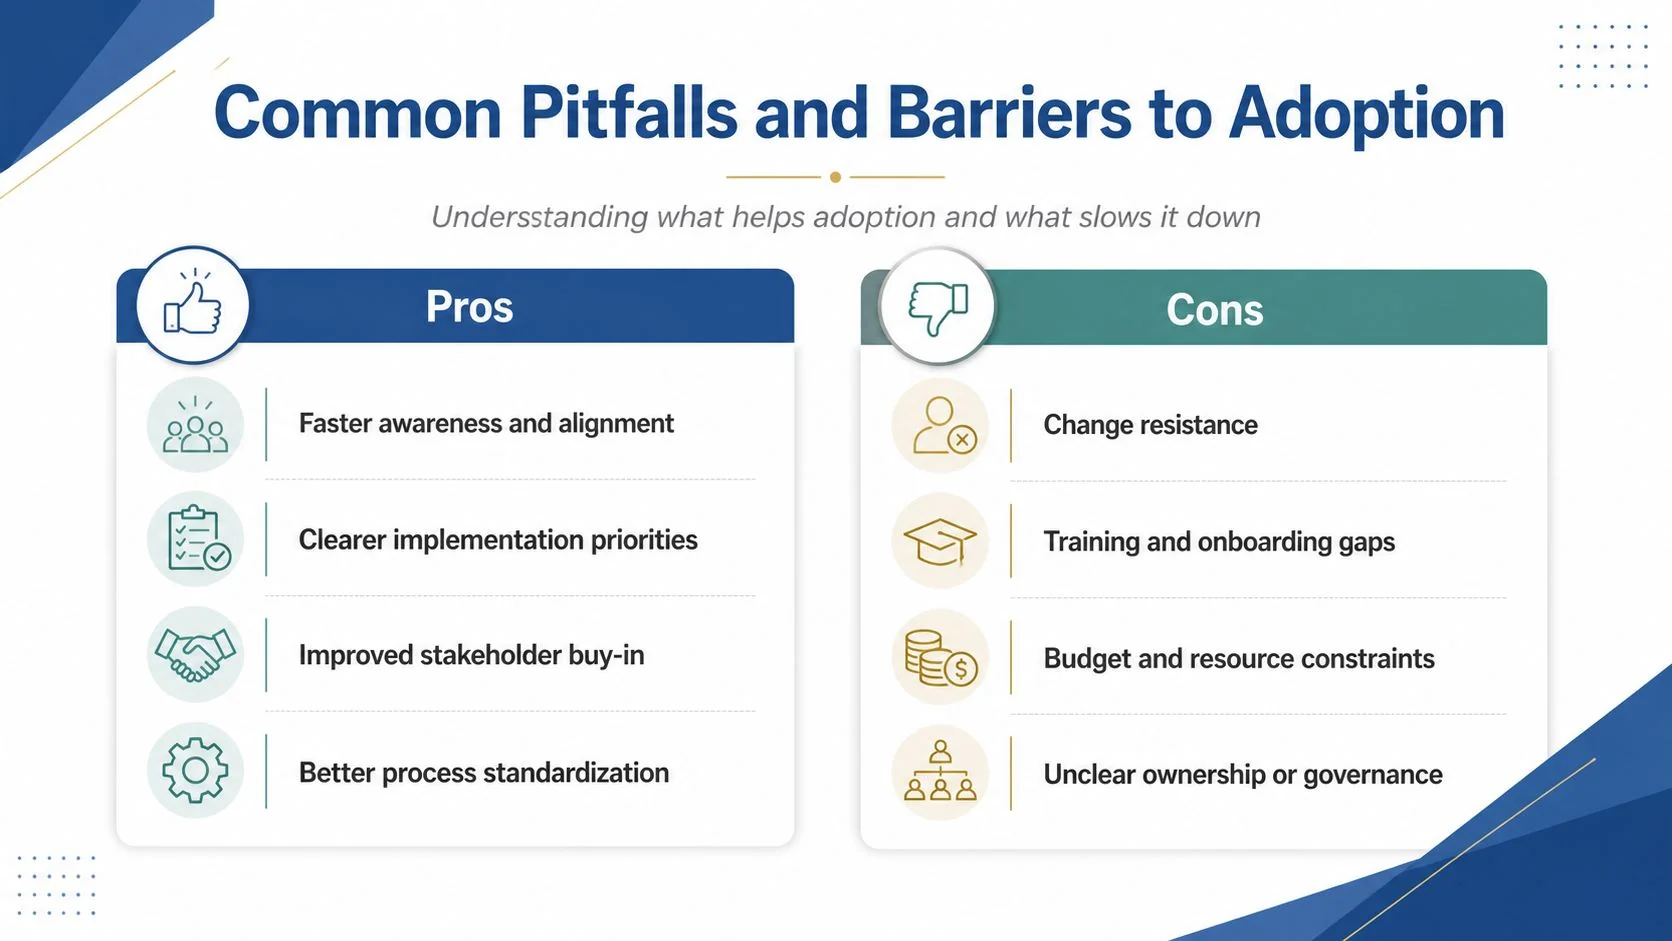
The expensive mistake is buying technology before fixing the operating conditions around it. More dashboards cannot resolve conflicting definitions, and more sensors cannot correct fragmented ownership. A small set of trusted, workflow-embedded use cases, prioritized by payback speed and deployability, usually provides a stronger route to scale than a broad platform rollout.
Evaluating Options With Evidence-Based Research
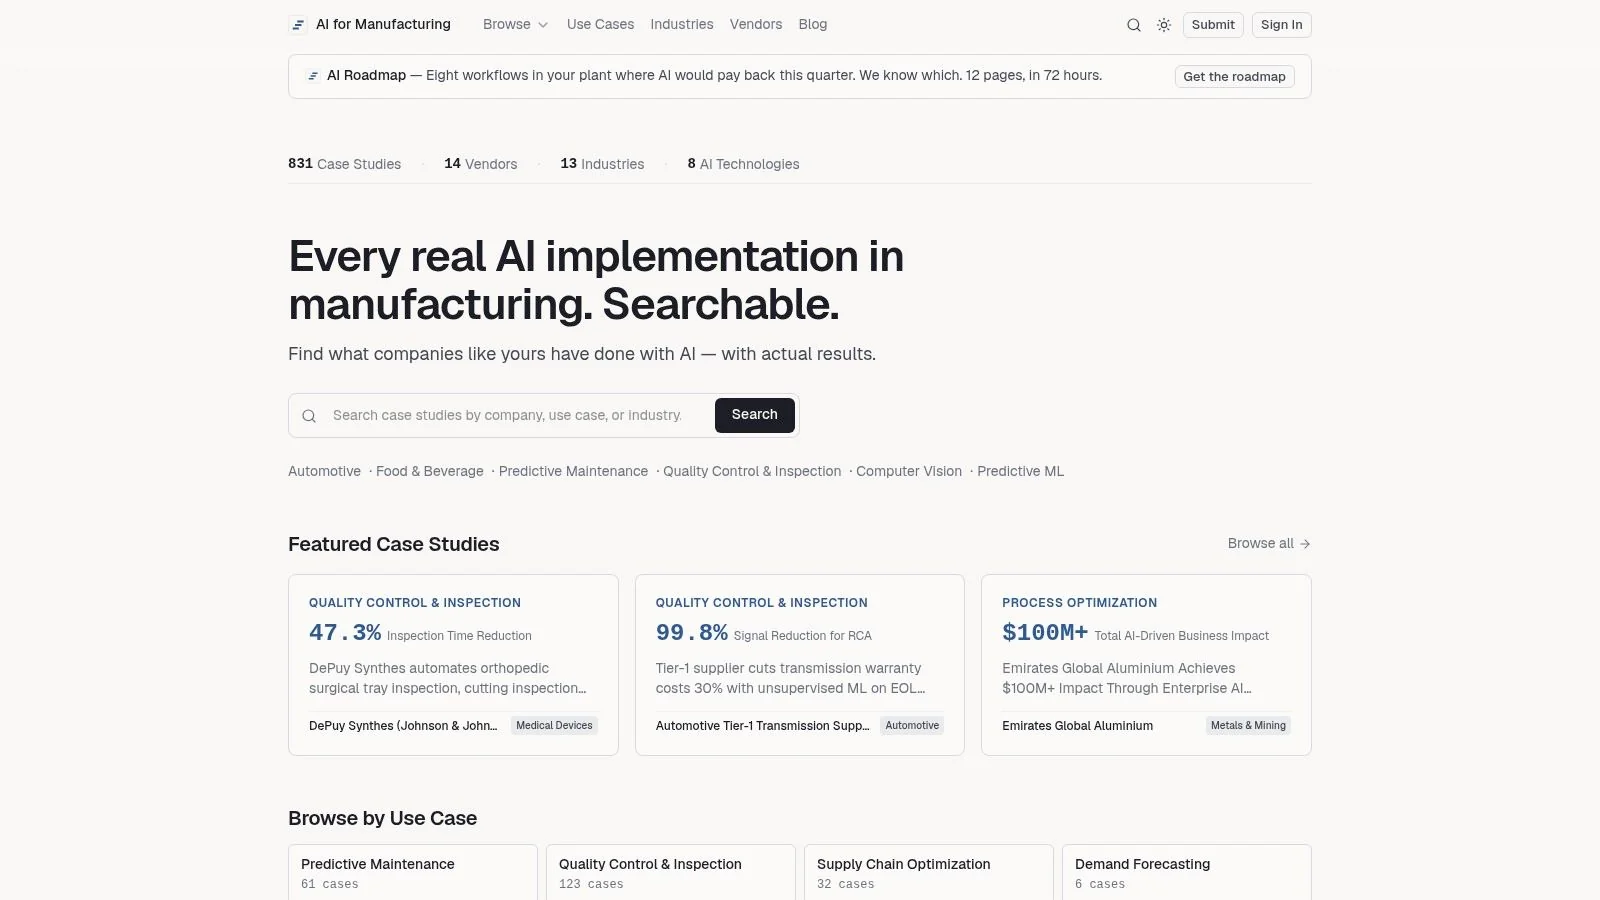
Vendor claims should be treated as hypotheses until the evidence is traceable and relevant to the plant. Start by searching documented manufacturing implementations, then filter for the conditions that resemble your operation. The AI for Manufacturing database supports filters by industry across 13 categories, use case across 11 types, AI technology across 8 categories, and company size, allowing teams to narrow research before speaking with suppliers.
Read each case record for the metric definition, result summary, technology classification, implementation context, and source link. Separate vendor-reported outcomes from independently verified results. Verification levels such as Verified, Contributed, and Scraped make evidence strength visible, which is more useful than treating every case study as equally reliable.
A practical evaluation workflow
- Filter for plant similarity. Match the industry, workflow, equipment context, and company size as closely as possible.
- Compare the decision process. Check whether the documented solution changes maintenance planning, inspection, scheduling, or another action your plant can control.
- Audit the metric. Ask what the baseline was, how the result was calculated, and whether the source is vendor-reported or independently verified.
- Test deployment conditions. Confirm required integrations, data history, operator interaction, cybersecurity review, and local support.
- Build a short business case. Use peer evidence as a range for discussion, not as a guaranteed outcome.
AI for Manufacturing also offers an AI Roadmap deliverable covering eight plant workflows with near-term payback, which can help structure opportunity screening before a plant commits to a specific implementation.
Manufacturing data analytics is the foundation for AI for manufacturing use cases because model performance and adoption depend on data meaning, quality, integration, and workflow response. Plant leaders should assess analytics readiness before approving AI pilots, select a use case that can survive daily operations, and scale only after the data product and decision process work together reliably.
Start by mapping one plant workflow, its source systems, metric definitions, owners, and operational response. Then use documented case evidence to select a high-confidence AI opportunity, validate its data readiness, and build a business case that your operators, engineers, and finance team can all audit.
