Machine Vibration Monitoring for AI
Master machine vibration monitoring for AI manufacturing. Learn sensor options, ISO standards, false alarm reduction, and multi-signal diagnostic strategies.
Written by AI for Manufacturing
Machine vibration monitoring is the continuous or periodic measurement and analysis of mechanical oscillations in rotating equipment to assess machine health and identify abnormal behavior. The counterintuitive point for manufacturing AI teams is that adding sensors doesn't automatically improve prediction. Vibration data becomes valuable only when measurement quality, operating context, thresholds, and maintenance actions are governed together.
That distinction matters because vibration is often the highest-fidelity signal for mechanical degradation in motors, pumps, turbines, compressors, gearboxes, and other rotating assets. A model trained on inconsistent sensor placement, mixed operating states, or poorly tuned alarms can produce technically impressive predictions that operators still ignore. For AI in manufacturing, machine vibration monitoring isn't merely a maintenance instrument. It is a demanding industrial data pipeline.
Table of Contents
- Defining Machine Vibration Monitoring and AI Readiness
- Sensor Hardware and Signal Processing Fundamentals
- Solving the False Alarm Problem in Predictive Models
- Multi-Signal Diagnostics for Complete Machine Coverage
- Practical Implementation Checklist for Plant Teams
- Connecting Vibration Data to Manufacturing AI Use Cases
Defining Machine Vibration Monitoring and AI Readiness
Machine vibration monitoring measures oscillatory motion produced by operating equipment, then analyzes changes in amplitude, frequency, waveform, or related features. Teams collect readings periodically with handheld instruments or continuously through permanently installed sensors. The purpose is to detect abnormal mechanical behavior, diagnose developing faults, and support decisions about inspection, repair, and operation.
The mechanical signal is particularly useful for AI because many rotating faults alter vibration before the equipment reaches an obvious failure state. Imbalance, misalignment, looseness, bearing degradation, gear damage, and resonance can produce patterns that differ from a healthy operating baseline. A predictive model can learn those patterns, but only if the data preserves the physical conditions under which they occur.
A mainstream industrial data layer
The market has moved well beyond vibration analysis as a specialist troubleshooting technique. One estimate valued the global vibration monitoring market at USD 1.85 billion in 2024 and projected it to reach USD 2.69 billion by 2029, representing a 7.8% CAGR from 2024 to 2029, according to MarketsandMarkets' vibration monitoring market analysis. A separate forecast placed the market at USD 1.7 billion in 2023 and projected USD 2.91 billion by 2030, with a 7.9% CAGR, using the same market source.
The difference between forecasts isn't a problem to hide. It shows that market boundaries and forecasting methods vary, while the direction is consistent. Online monitoring and sensor hardware are central subsegments, reflecting the industrial shift from periodic manual checks toward continuous condition monitoring.
Why AI teams should care
Historically, practical industrial vibration monitoring expanded in the late 1960s and early 1970s as proximity probes enabled engineers to measure shaft motion directly and study rotor dynamics and shaft bending resonances. This development helped establish vibration analysis as a maintenance discipline rather than only a troubleshooting aid, as described in the historical account of vibration monitoring.
The lesson for an AI practitioner is straightforward. A model's predictive value is bounded by the physical meaning of its inputs. A vibration trend without speed, load, machine identity, sensor location, and maintenance history is incomplete evidence. Build the data layer first, then select the model.
Sensor Hardware and Signal Processing Fundamentals
A useful vibration system has four connected stages: mechanical sensing, signal conditioning, feature extraction, and decision logic. Failure at any stage can create misleading AI inputs.
The sensor choice determines what the system can observe. Accelerometers provide broad frequency response and are widely used for rotating equipment. Velocity measurements can support overall severity assessment in common rotating machinery. Proximity probes measure shaft displacement directly and are important on large machines where shaft motion relative to bearing housings matters.
The installation point matters just as much. Mount sensors near bearings, use a rigid mechanical connection, and keep measurement direction consistent. Horizontal, vertical, and axial readings can reveal different behavior. A sensor moved to another surface may change the signal enough to make a historical trend unreliable, even though the machine itself hasn't changed.
From waveform to model feature
The digital pipeline usually starts with a time waveform. Signal processing can then produce frequency spectra, overall amplitude values, velocity or acceleration bands, envelope features, phase information, and order-related features for variable-speed equipment. Each representation answers a different diagnostic question.
- Time waveform: Useful for impacts, intermittency, modulation, looseness, and other transient behavior.
- Frequency spectrum: Helps separate running-speed components from higher-frequency bearing or gear activity.
- Trend data: Shows whether a machine's behavior is stable, improving, or deteriorating under comparable operating conditions.
- Context fields: Speed, load, temperature, process state, and maintenance events help the model distinguish a fault from a normal operating transition.
Early proximity probes demonstrated the value of measuring shaft motion directly. Modern systems add accelerometers, edge processing, wireless connectivity, and cloud analytics, but the engineering requirement is unchanged. The signal must represent the machine state consistently.
For teams building an industrial IoT architecture, sensor selection should sit alongside data modeling and integration decisions. The guidance on IoT sensors for predictive maintenance is relevant because a sensor network needs a clear relationship between asset identity, measurement location, timestamp, and downstream maintenance workflow.
Using ISO severity without confusing it with diagnosis
ISO standards provide a common measurement and evaluation framework, but a severity zone is not a complete diagnosis. ISO 20816-3:2022 covers industrial machinery above 15 kW and operating at 120 to 30,000 r/min, using in-situ broadband measurements on shafts, bearings, pedestals, or housings. It classifies severity into Zones A through D. Zone B is acceptable for unrestricted long-term operation, while Zone C is unsatisfactory for long-term continuous operation, according to ISO 20816-3:2022.
| Zone | Machine condition | AI / Maintenance action |
|---|---|---|
| A | Typical condition for a new machine | Establish or confirm the baseline and preserve operating context |
| B | Acceptable for unrestricted long-term operation | Continue monitoring and learn the normal operating envelope |
| C | Unsatisfactory for long-term continuous operation | Plan investigation and corrective maintenance |
| D | Vibration severe enough to cause damage | Escalate urgently and assess safe operating limits |
The broader ISO 20816-1 framework provides general conditions and procedures for measuring and evaluating vibration on complete machines. Use these zones to support thresholds, not to replace spectral diagnosis. AI systems should combine severity, trend direction, operating state, and diagnostic features before recommending action.
Solving the False Alarm Problem in Predictive Models
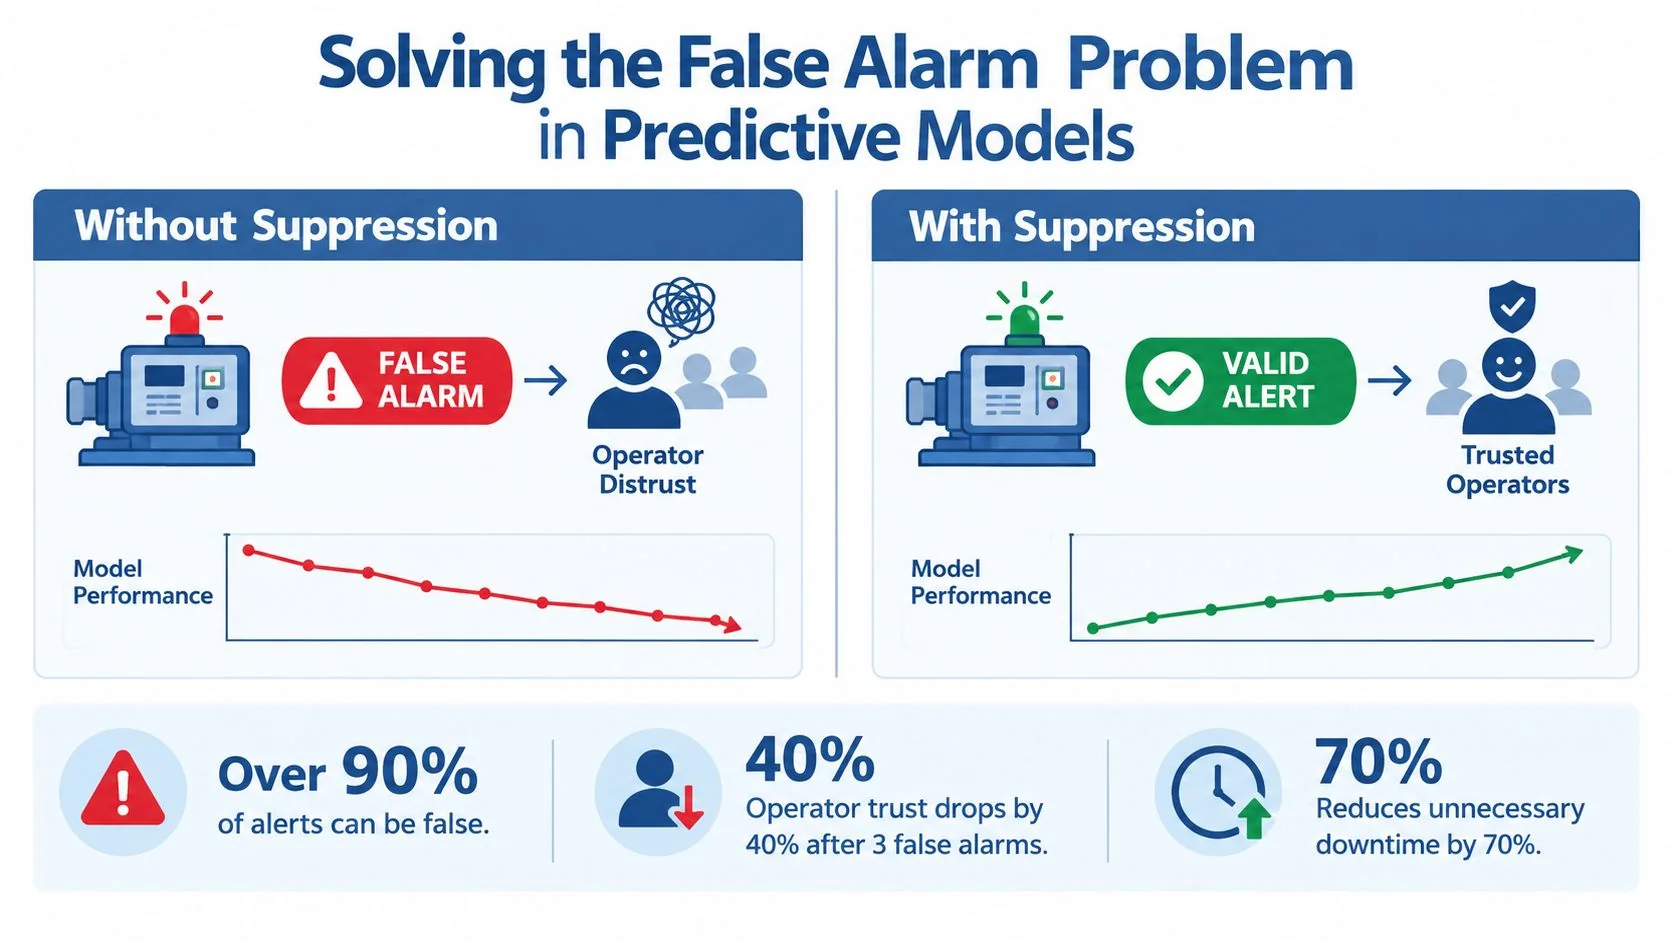
The hardest condition-monitoring problem isn't detecting an unusual signal. It is deciding whether the signal deserves attention. Excessive false alarms erode operator confidence, and once technicians stop trusting alerts, even accurate predictions lose operational value.
Technical literature on alarm and statistical-model tuning shows how much the decision layer can matter. One study reported approximately 33% false alarms for an analysis-parameter method compared with approximately 7% for a statistical-model approach, as documented in the technical literature on vibration alarm tuning.
Why more sensors can make AI worse
More measurements create more opportunities for inconsistent baselines, missing data, sensor drift, and conflicting alerts. A neural network trained on raw vibration streams may identify statistical differences without understanding whether a pump changed speed, a sensor loosened, or a process state shifted.
An alert layer should include:
- Operating-state segmentation: Compare vibration with comparable speed, load, and process conditions.
- Persistence rules: Require a change to remain meaningful before escalating it.
- Sensor-quality checks: Detect flatlines, saturation, implausible jumps, and communication gaps.
- Statistical baselines: Model normal variation rather than applying one fixed threshold to every machine.
- Maintenance feedback: Record whether an alert led to inspection, confirmed fault, false positive, or no action.
Edge analytics can reduce latency and data overload, but it also moves governance closer to the sensor. Thresholds, suppression rules, model versions, and validation results must remain visible to reliability engineers. The predictive maintenance models guide is useful when comparing model strategies, but deployment still depends on plant-specific alert ownership.
Practical rule: An alert that technicians can't interpret, verify, and route to an action is not a successful AI output.
Multi-Signal Diagnostics for Complete Machine Coverage
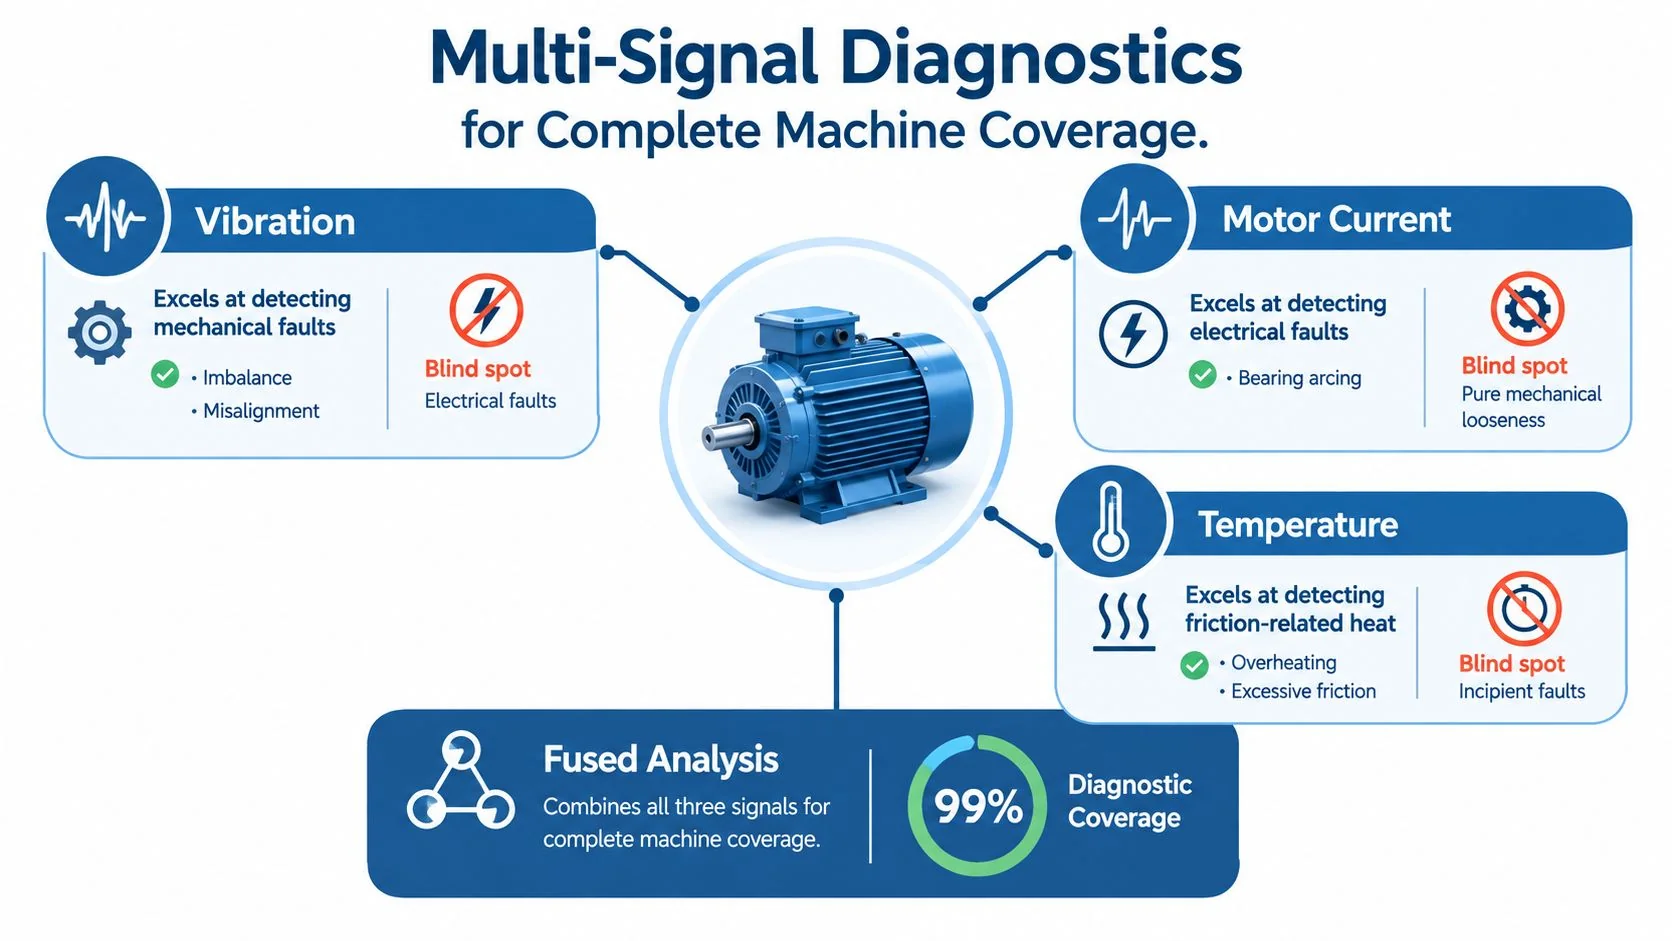
Vibration is strongest when the failure mechanism is mechanical. It can expose bearing defects, imbalance, misalignment, looseness, and related rotating-equipment problems. It isn't a universal sensor for motor health, and a model that treats it as one will inherit blind spots.
Electrical faults may require complementary signals such as motor current signature analysis. Temperature adds another perspective, particularly when friction or thermal behavior becomes meaningful. The architecture should therefore treat vibration as one diagnostic modality in a broader stack, not as the sole representation of asset condition.
Choosing signals by failure class
The practical design question isn't “Which sensor is best?” It is “Which failure modes must the system detect?”
- Vibration: Strong for mechanical faults, including imbalance, misalignment, bearing defects, and looseness. It can miss some electrical problems.
- Motor current: Useful for electrical behavior and motor-related anomalies. It won't fully describe every mechanical issue.
- Temperature: Helpful for friction-related heat and thermal changes. It may lag behind early-stage degradation.
- Fused analysis: Combines heterogeneous evidence and gives the model more context for separating mechanical, electrical, and thermal causes.
A 2026 industry analysis claims that coverage rises from roughly 55% to 65% with vibration alone to over 94% when vibration is combined with current analysis, and says current-based methods can identify some electrical faults 60 to 180 days before failure, according to the analysis of vibration and current-based motor predictive maintenance. Those are source-specific claims, not universal plant guarantees. Treat them as an architectural argument for evaluating coverage by fault class.
For implementation examples, the Acciona Agua predictive maintenance case study illustrates the relevance of combining vibration and temperature monitoring for water-pump assets. The AI implication is clear: fuse signals at the edge where possible, preserve raw evidence for investigation, and align each feature with a known physical failure mechanism.
Practical Implementation Checklist for Plant Teams
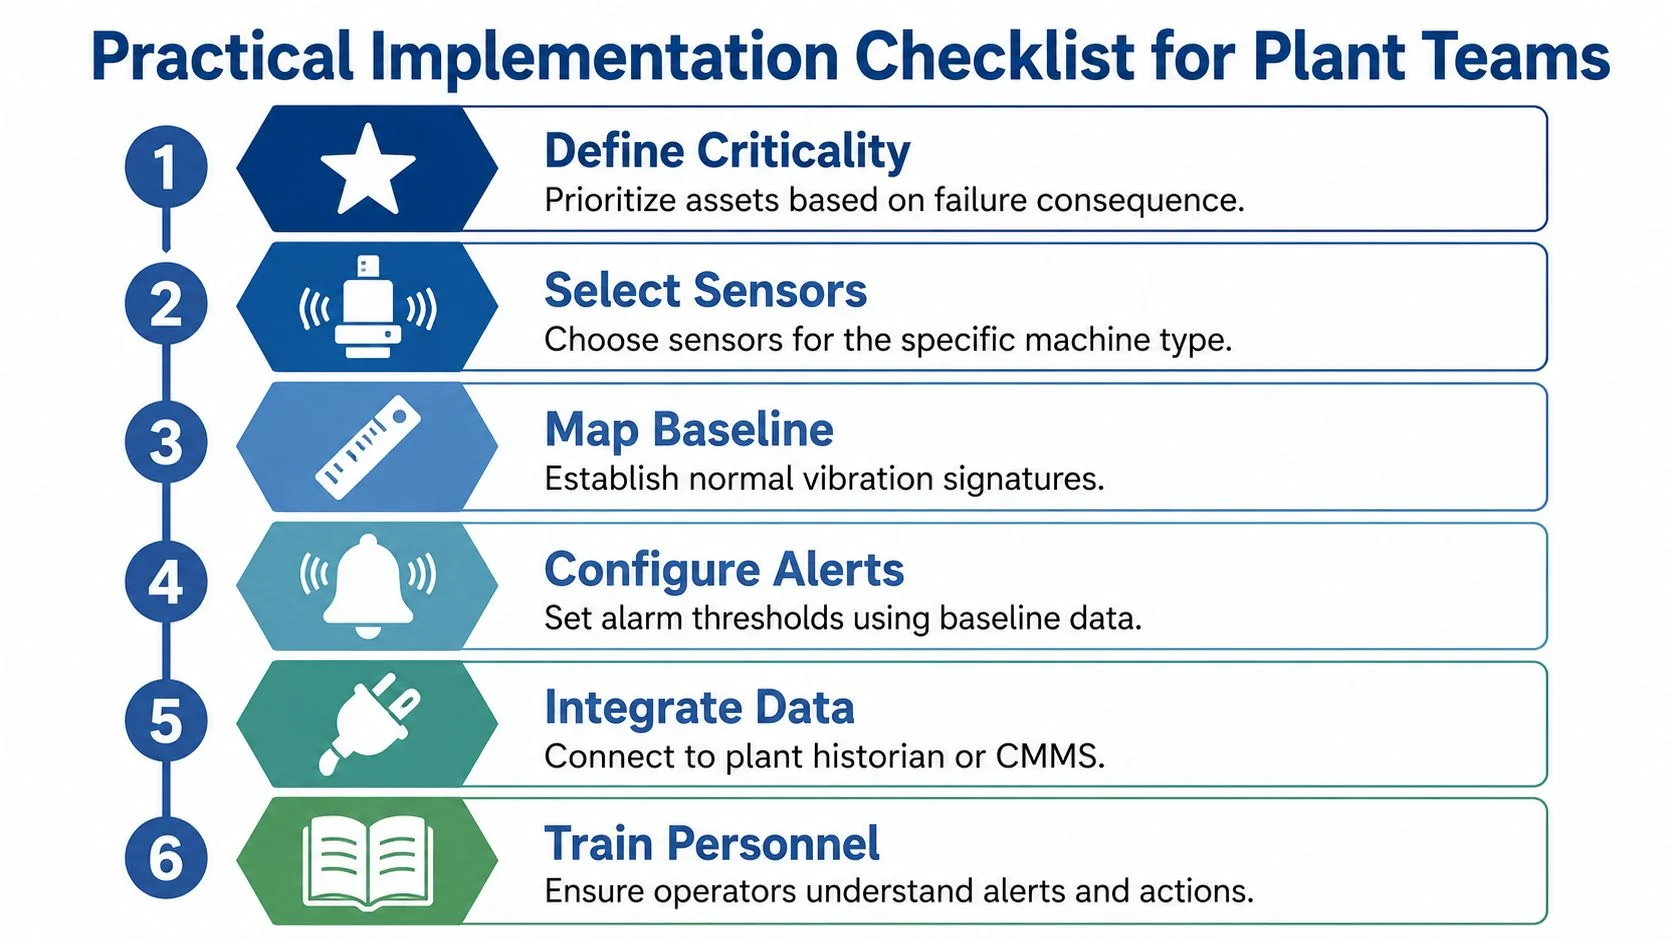
A successful deployment starts with maintenance decisions, not a sensor shopping list. Plant teams should define what they need to know, which assets justify monitoring, and how an alert will move from detection to work order.
Six steps that preserve AI readiness
-
Define criticality. Rank assets by safety, production, quality, environmental, and repair consequences. Start with machines where reliable early warning can change a maintenance decision.
-
Select sensors for the machine. Choose accelerometers, velocity sensing, or proximity probes according to machine construction and the failure modes that matter. Screening data may be sufficient for less critical equipment, while production-critical machinery may need continuous, high-resolution measurements.
-
Map the baseline. Capture healthy readings at known operating states. Record asset identity, sensor location, direction, speed, load, process conditions, and timestamp. Without those fields, the model may learn operating variation instead of degradation.
-
Configure alerts from evidence. Use baseline behavior, ISO severity guidance, trend changes, and diagnostic features together. ISO 13373-1 and ISO 13373-3 frame condition monitoring as measurement plus diagnosis, with emphasis on trending changes as well as absolute levels, as described in the ISO vibration condition-monitoring standards.
-
Integrate the data. Connect the monitoring platform to the plant historian, computerized maintenance management system, or work-order workflow. Preserve the link between alert, investigation, confirmed cause, repair, and post-repair reading.
-
Train personnel. Operators need to know what an alert means and what action is expected. Reliability engineers need access to spectra, trends, sensor-quality indicators, and model behavior so they can challenge incorrect recommendations.
Data quality is a maintenance control, not an analytics afterthought.
Run validation before scaling. Check whether sensors remain attached, whether measurements arrive at the expected cadence, whether machine states are labeled, and whether technicians close the feedback loop. A smaller clean deployment is more useful to an AI team than a large network producing ambiguous records.
Connecting Vibration Data to Manufacturing AI Use Cases
High-quality vibration data can trigger workflows beyond maintenance. A rising mechanical risk score can influence production scheduling, spare-parts planning, inspection priorities, energy analysis, and operating limits. The value comes from connecting a condition signal to a decision system that understands production constraints.
Dynamic scheduling is one example. If an asset shows a credible deterioration pattern, a planning system can favor work that uses the machine while it remains within an approved operating state, then reserve maintenance time before the risk becomes urgent. That decision requires more than an alarm. It needs asset criticality, production orders, maintenance capacity, parts availability, and confidence in the diagnosis.
Spare-parts automation follows the same logic. A confirmed bearing-related pattern can create a review task for inventory and procurement, while an uncertain alert should remain an investigation rather than trigger an unnecessary order. Energy optimization also benefits from context. Mechanical degradation can change how efficiently equipment performs, but the model must distinguish equipment condition from normal changes in demand or process operation.
Manufacturing AI teams should therefore treat vibration monitoring as a foundational input to an industrial decision graph:
- Sensor layer: Vibration, current, temperature, speed, and process context.
- Analytics layer: Baselines, features, anomaly detection, diagnosis, and confidence.
- Workflow layer: CMMS actions, inspections, scheduling, inventory, and escalation.
- Learning layer: Technician outcomes, repair evidence, and post-maintenance validation.
AI for Manufacturing provides a searchable database of documented manufacturing AI implementations with filters for industry, use case, technology, and company size, plus structured records and source links. It can be used alongside reliability engineering analysis when teams compare possible AI applications and evidence.
The central position is practical. Clean, low-noise vibration data is a prerequisite for trustworthy manufacturing AI, not a finished AI use case by itself. Build consistent sensing, contextual labeling, calibrated alert governance, and multi-signal coverage first. Then predictive models and AI agents can support decisions across the plant instead of generating another stream of alarms that people learn to disregard.
Start your next manufacturing AI initiative by auditing the vibration data from a small set of critical assets. Document sensor locations, operating context, baseline quality, alarm outcomes, and maintenance feedback, then use that evidence to define a focused pilot and evaluate relevant implementations through the AI for Manufacturing database.
