AI for Demand Forecasting: 2026 Manufacturing Playbook
See how AI for demand forecasting helps manufacturers cut inventory costs, reduce stockouts, and plan production with accurate 2026 demand signals.
Written by AI for Manufacturing
In AI for demand forecasting, the algorithm often isn't the main constraint. Evidence from manufacturing surveys indicates that only 36% of firms said they could make informed decisions with their current data, while 44% reported AI project failures caused by poor data quality (Dun & Bradstreet Manufacturing Pulse Survey). For a factory, forecast quality matters only when it improves purchasing, production sequencing, capacity allocation, inventory policy, and customer service without destabilizing the schedule.
Table of Contents
- What AI Demand Forecasting Actually Means for Manufacturing
- Choosing Between Statistical, Machine Learning, and Deep Learning Models
- Data Requirements and Feature Engineering for Factory Environments
- Evaluation Metrics and Probabilistic Forecasting for Production Decisions
- Implementation Roadmap from Pilot to Plant-Wide Scale
- Common Pitfalls and How Manufacturing Teams Avoid Them
- Evidence-Backed Case Studies from Manufacturing Implementations
- Closing the Loop From Forecast Accuracy to Manufacturing Outcomes
What AI Demand Forecasting Actually Means for Manufacturing
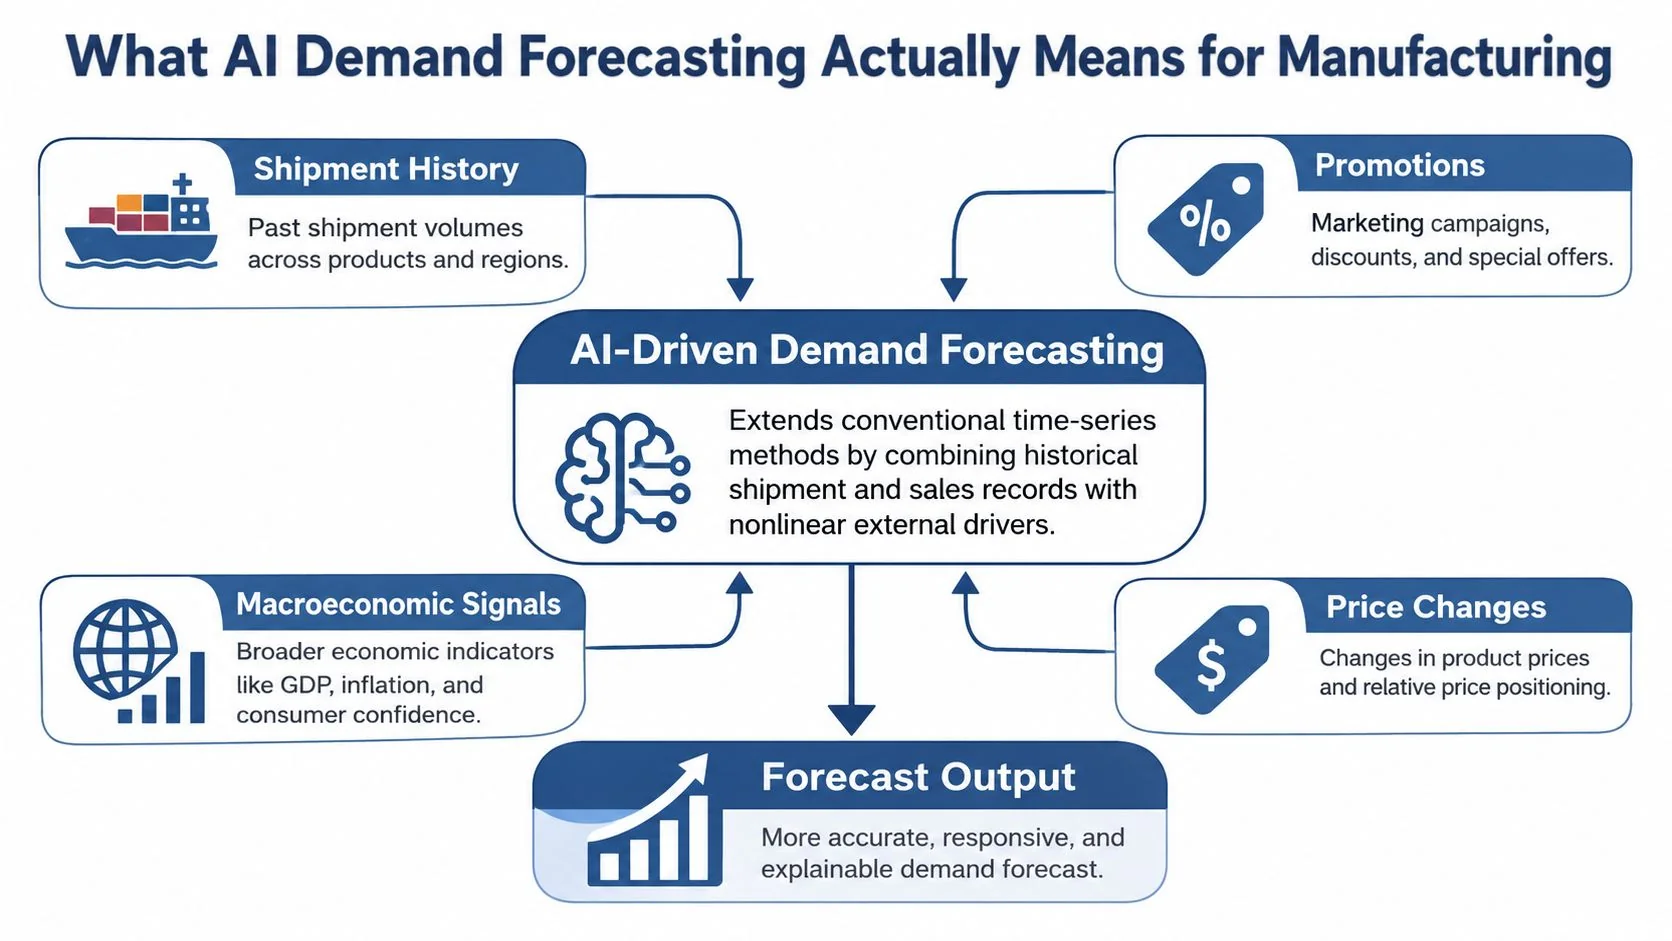
AI-driven demand forecasting extends conventional time-series forecasting. It combines historical shipment and sales records with nonlinear drivers such as prices, promotions, competitor signals, weather, and macroeconomic conditions. That makes it more useful for manufacturing environments where customer orders, raw-material constraints, commercial activity, and market shocks can change the relationship between yesterday's demand and tomorrow's production requirement.
This approach isn't a complete replacement for ARIMA or exponential smoothing. Those methods remain valuable baselines because they provide transparent comparisons and can perform well when demand is stable, seasonal, and adequately represented by its own history. A more credible deployment tests whether AI adds decision value over those baselines instead of assuming that a complex model must win.
Link the forecast to the planning horizon
A one-week forecast may guide finished-goods replenishment, while a longer horizon affects raw-material purchasing, supplier commitments, labor planning, and capacity reservations. The model therefore needs to reflect actual production constraints, including minimum runs, changeover rules, lead times, component availability, and customer-order commitments.
A 2026 comparative study using 36 months of point-of-sale records from 14 retail organizations found that hybrid LSTM-XGBoost models achieved an average 28.6% reduction in mean absolute percentage error at the four-week horizon compared with traditional methods (comparative forecasting study). That result is evidence from one study, not a universal manufacturing benchmark. It does show why horizon-specific testing matters, particularly because high-velocity, promotion-sensitive products benefited more than slow-moving, low-volatility items.
Practical rule: Evaluate performance by planning horizon, product family, and demand volatility. A single company-wide accuracy figure can hide the products that create the greatest schedule and inventory risk.
Choosing Between Statistical, Machine Learning, and Deep Learning Models
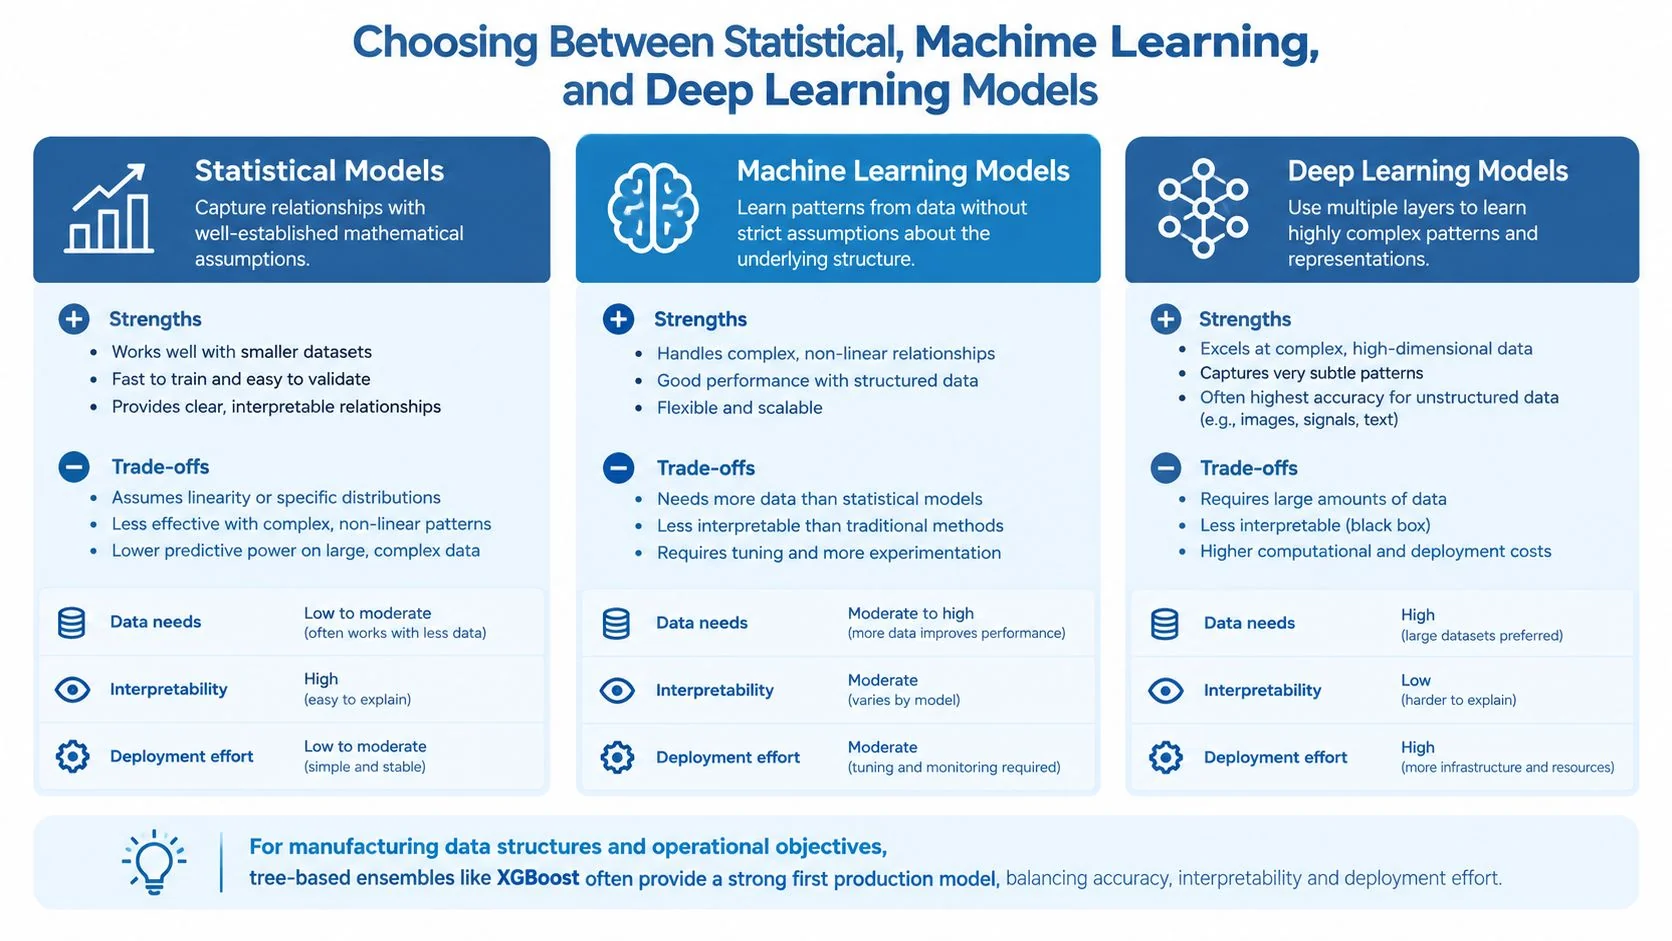
Model choice should follow the structure of the data and the decision the plant needs to make. Statistical models are often the right starting point for a stable series with clear seasonality and limited explanatory data. ARIMA and exponential smoothing are interpretable, quick to maintain, and useful as control benchmarks.
Machine-learning models become attractive when the forecast depends on many tabular drivers. XGBoost, for example, can combine product, plant, customer, price, promotion, calendar, lead-time, and inventory features. A 2026 benchmark using 913,000 daily sales records across 50 items and 10 stores, together with the Rossmann benchmark containing daily sales for as many as 1,115 stores, found that tree-based ensembles, particularly XGBoost, consistently outperformed deep-learning and hybrid architectures on structured demand data (Frontiers benchmarking study).
Match model complexity to operational value
| Model family | Strong fit | Main trade-off |
|---|---|---|
| Statistical | Stable, seasonal demand with limited drivers | May miss nonlinear effects and external signals |
| Tree-based machine learning | Structured data with many product, plant, commercial, and inventory features | Requires disciplined feature construction and monitoring |
| Deep learning | Long temporal dependencies, high-dimensional signals, and many related series | Greater data, governance, retraining, and explanation requirements |
Tree-based ensembles also support feature-importance analysis and efficient retraining as product mix changes. Neural sequence models can be useful when long temporal dependencies or large volumes of related time series justify their additional governance burden. They shouldn't be selected merely because they sound more advanced.
Use rolling-origin validation rather than a random train-test split. Test one-step and multi-step horizons separately, then examine how each forecast changes schedule stability, inventory exposure, and service performance. A useful overview of practical forecasting workflows from Cyndra can complement a manufacturing-specific design, while this guide to random forest in machine learning helps teams compare another tree-based option.
Data Requirements and Feature Engineering for Factory Environments
A factory rarely observes pure demand. If a customer wanted more units but the plant was out of stock, the shipment record captures constrained supply rather than true demand. Treating that record as ordinary demand teaches the model to underforecast the very products that need better availability.
Start with a minimum viable pilot dataset:
- Historical shipments and customer orders: Keep both fulfilled and unfulfilled signals where they can be identified.
- Commercial drivers: Capture price lists, discounts, promotion calendars, and effective dates.
- Supply context: Include lead times, inventory positions, open purchase orders, production capacity, and known constraints.
- Product and plant master data: Standardize units of measure, product families, locations, customer identifiers, and substitution relationships.
Feature engineering should respect the information available at forecast creation time. A future promotion flag is valid only if the promotion was known then. A future inventory position or corrected shipment value creates leakage and produces a model that looks good in testing but fails in production.
Segment before adding complexity
Separate products by stability, intermittency, seasonality, and disruption sensitivity. Stable repeat items may need only lagged demand, calendar variables, and lead-time features. Intermittent or low-volume items may require occurrence-based logic, human review, or a probabilistic approach rather than a single aggressive machine-learning model. New products need analogues, customer commitments, launch assumptions, and explicit cold-start handling because historical sales don't yet exist.
Ownership matters as much as transformation logic. Sales should own promotion and customer-order visibility, supply planning should own constraints and lead times, and master-data teams should govern units and product hierarchies. Automated checks should flag missing dates, sudden unit changes, duplicate orders, impossible lead times, and feature freshness before a forecast reaches the planning system.
Evaluation Metrics and Probabilistic Forecasting for Production Decisions
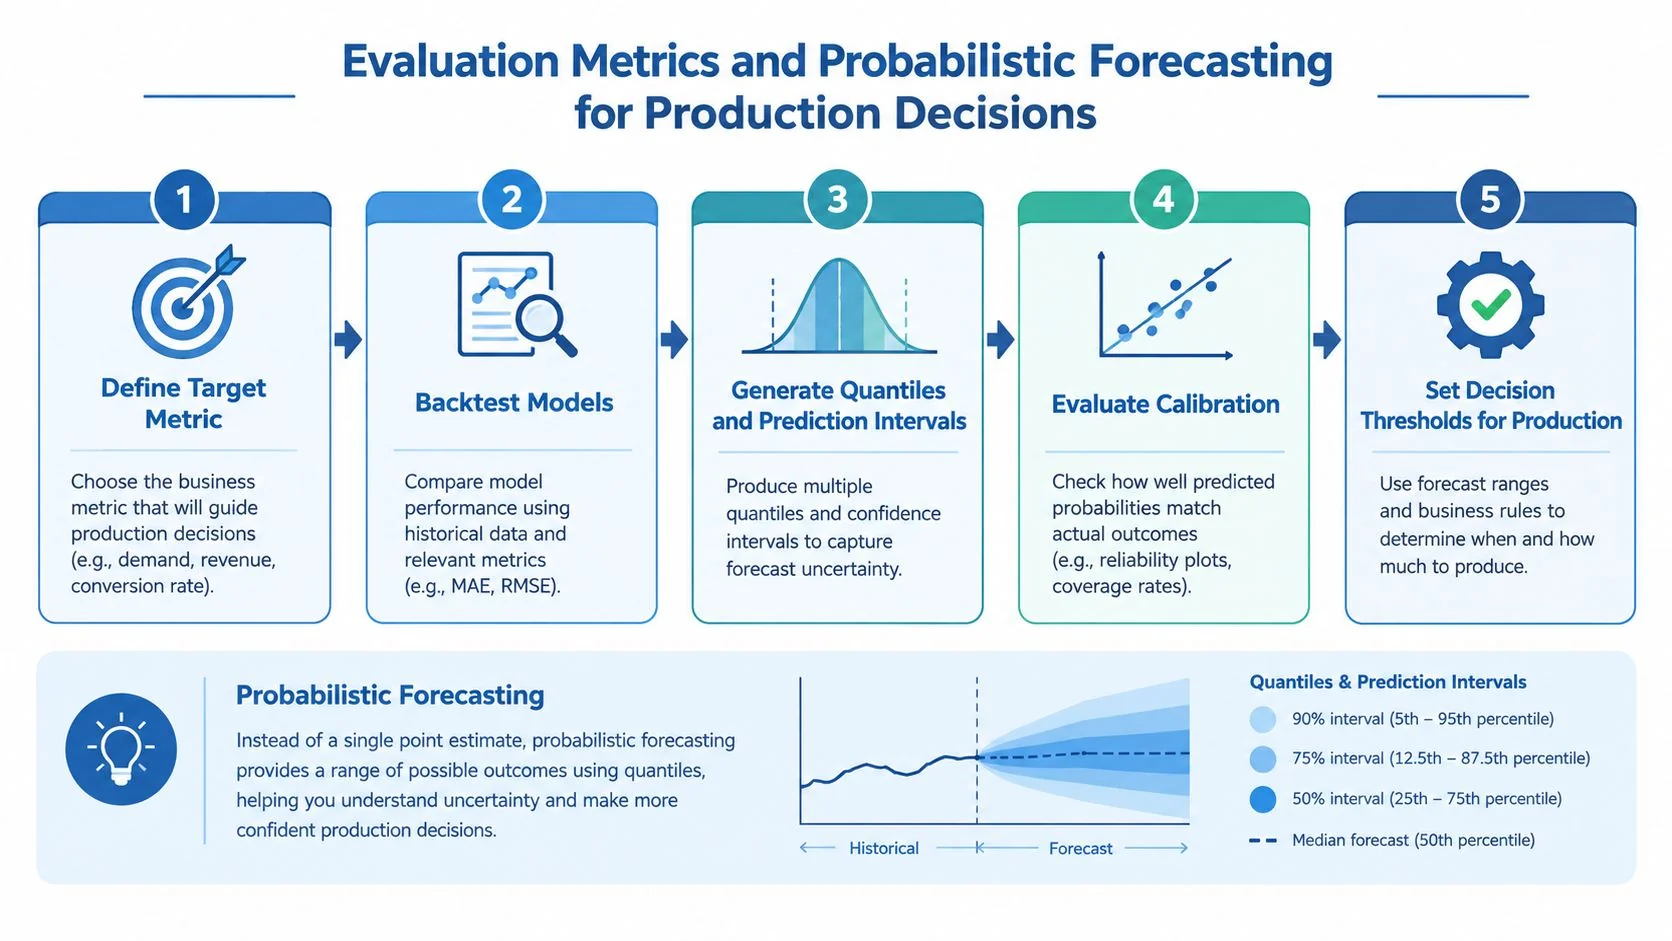
A point forecast answers, “What demand number should we expect?” Manufacturing decisions need a second answer: “How wrong could that number be, and what should we do about it?” Probabilistic forecasting represents uncertainty through quantiles or prediction intervals, allowing planners to connect forecast risk to safety stock, capacity buffers, and production-plan exposure.
The M5 forecasting competition used real Walmart sales data with price, event, and calendar variables across a hierarchical product-location structure. Its design assessed probabilistic forecasts with scaled pinball loss alongside point-forecast measures such as RMSSE, a useful pattern for factories that need both accuracy and uncertainty evaluation.
Score the decisions, not only the predictions
A practical evaluation loop looks like this:
- Define the target metric: Choose service level, inventory turns, schedule adherence, and cash-conversion cycle alongside forecast error.
- Backtest realistic horizons: Use rolling-origin tests that reflect supplier and production lead times.
- Generate intervals: Produce quantiles for each horizon instead of one number.
- Check calibration and sharpness: A stated interval should contain actual demand at the rate it claims, while remaining useful rather than excessively wide.
- Set decision thresholds: Convert upper-tail risk into capacity buffers or safety-stock rules, with different treatment for constrained components and routine items.
Hierarchical forecasts should reconcile across SKU, product family, plant, region, and enterprise levels. Otherwise, local forecasts may look plausible while totals contradict production or financial plans. Underestimating the upper tail for a constrained component can cause line stoppages. Overestimating routine demand can increase working capital and obsolescence.
Compare every AI model with a seasonal-naive baseline and relevant statistical methods. Then measure what changed operationally, not just statistically. Guidance on demand forecasting accuracy is useful only when its metrics are connected to the plant's actual shortage and excess-inventory costs.
Implementation Roadmap from Pilot to Plant-Wide Scale
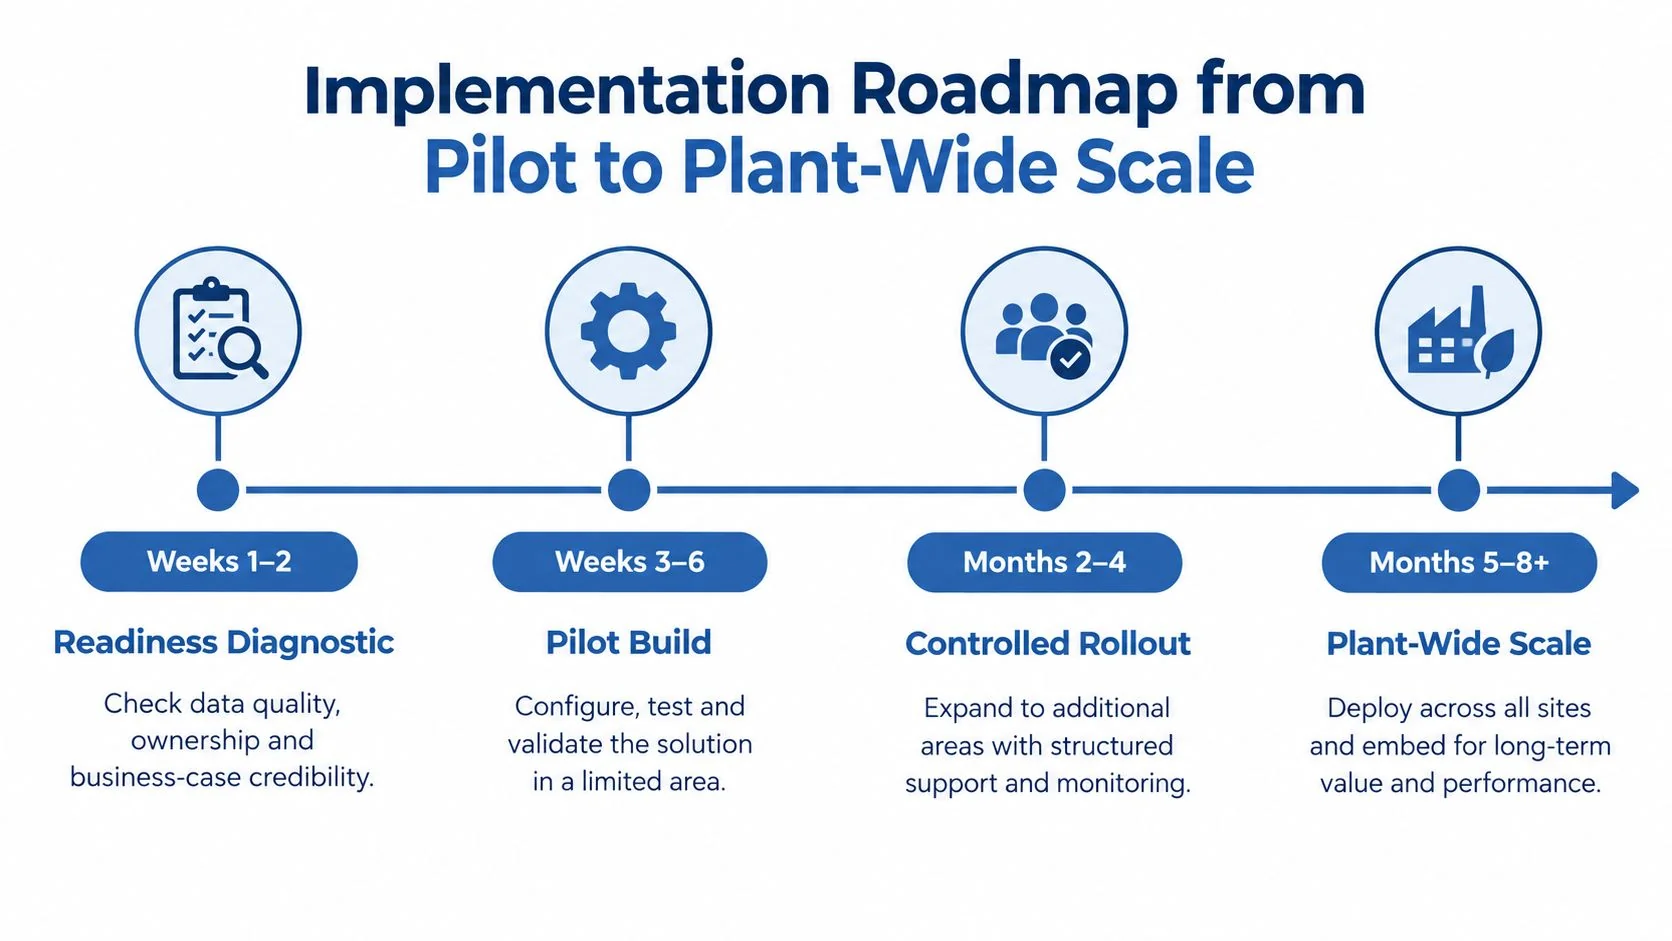
Begin with a readiness diagnostic, not a model. Check whether demand records distinguish sales from shipments, whether promotion and order data are accessible, whether product hierarchies are consistent, and whether one owner can approve changes to the forecast. Confirm that planners and operations leaders agree on the business outcome before data scientists start tuning algorithms.
A sensible rollout has four gates:
- Readiness diagnostic: Establish data quality, ownership, decision cadence, and a credible business case.
- Pilot build: Select a product family with reasonably stable signals, manageable lead times, and measurable downstream outcomes. Build a statistical baseline before adding features.
- Controlled rollout: Run AI forecasts alongside the existing process. Use rolling-origin validation, planner review, and a documented override policy.
- Plant-wide scale: Expand only after the pilot demonstrates better operational outcomes without creating schedule instability or unmanageable exception volume.
Define scale gates in business language
Track inventory turns, service level, schedule adherence, and the cash-conversion cycle. A 2022 peer-reviewed study of machine-learning demand forecasting in a steel-manufacturing context compared traditional methods with hybrid ARIMAX and neural-network approaches and reported statistically significant differences in supply-chain performance, including inventory and cash-efficiency outcomes (industrial forecasting study). The finding supports measuring downstream performance, while the specific setting means results shouldn't be transferred blindly to every plant.
Retraining needs an owner, a trigger, and a rollback path. Monitor data freshness, feature drift, forecast bias, interval calibration, planner overrides, stockouts, and excess inventory. Teams comparing internal development with software procurement can use a structured resource on build versus buy for AI tooling, but the decision should follow integration, governance, and maintenance requirements rather than model branding.
Common Pitfalls and How Manufacturing Teams Avoid Them
The most expensive assumption is that algorithm selection is the primary barrier. Survey evidence points elsewhere: 56% of manufacturers remained at the awareness or research stage for AI, with lack of business cases cited by 20% and workforce skill gaps by 17% (Dun & Bradstreet Manufacturing Pulse Survey). Poor data ownership and unclear operational accountability can defeat an excellent model.
| Factory condition | Common mistake | Better response |
|---|---|---|
| Promotion-sensitive demand | Learn temporary uplift as permanent demand | Normalize promotions and validate comparable periods |
| Frequent stockouts | Treat shipped units as unconstrained demand | Mark censored observations and use order or lost-demand signals |
| Intermittent items | Apply one model to every SKU | Segment and consider judgment or probabilistic methods |
| Multiple planning levels | Let local forecasts contradict totals | Reconcile the hierarchy |
| Changing product mix | Deploy a complex model without maintenance | Define retraining, drift checks, and rollback ownership |
Don't optimize MAPE while ignoring service level or schedule adherence. Don't fit recent promotions without distinguishing planned uplift from baseline demand. Don't deploy deep learning without a retraining plan, feature lineage, and a way for planners to understand exceptions.
A forecast is only production-ready when the planner knows what decision it changes, why it changed, and what risk remains.
Evidence-Backed Case Studies from Manufacturing Implementations
Published manufacturing case studies are useful only when they connect forecasts to operating decisions. The steel study described earlier examined forecast accuracy alongside inventory turns and the cash-conversion cycle. It reported statistically significant differences in supply-chain performance between traditional and machine-learning methods (peer-reviewed steel manufacturing research).
Its practical value is the evaluation design, not a universal architecture. Steel results may not transfer directly to plants with different product mixes, lead times, data quality, or shortage and excess costs. Use the findings to ask a sharper question: did forecast improvement change replenishment, inventory exposure, or working capital? A lower error score alone is not an implementation result.
For broader evidence, the AI for Manufacturing database lets teams search documented implementations by industry, use case, technology, and company size. Compare each example with your own readiness and decision process. Look for evidence that forecasts changed safety-stock settings, capacity buffers, purchasing actions, or service-level outcomes. Use gaps to frame vendor questions and pilot controls. Case studies should define comparable operating conditions, not promise universal performance.
Closing the Loop From Forecast Accuracy to Manufacturing Outcomes
The central operating principle: forecast quality has value only when it improves a decision. A lower error score matters when it supports a more reliable production plan, better raw-material purchasing, more appropriate capacity allocation, healthier finished-goods inventory, or stronger working-capital control. If the model creates frequent schedule changes, excessive overrides, or false confidence in constrained supply, statistical improvement may still produce operational damage.
Algorithm choice is part of the design, but it follows three prior questions. Is the data sufficient and governed? Does the evaluation represent uncertainty and realistic lead times? Does the forecast flow into the systems and meetings where planners make production, purchasing, and inventory decisions?
A practical leadership checklist
- Diagnose readiness: Verify demand history, stockout treatment, master data, feature ownership, and business-case accountability.
- Segment the pilot: Start with product families whose demand behavior and downstream KPIs can be measured clearly.
- Build a baseline: Compare seasonal-naive, ARIMA, exponential smoothing, and a suitable machine-learning model.
- Use probabilistic outputs: Translate intervals into safety stock, capacity buffers, and explicit risk thresholds.
- Track outcomes: Monitor service level, inventory turns, schedule adherence, stockouts, excess inventory, and the cash-conversion cycle.
- Govern the lifecycle: Assign owners for retraining, drift detection, planner overrides, documentation, and rollback.
Teams often begin with AI inventory management guidance, but inventory is only one part of the control loop. The forecast must also influence customer-order interpretation, procurement timing, production sequencing, and constrained-capacity decisions.
Start with one plant, one product segment, and one decision that currently creates measurable planning friction. Audit the data, establish a transparent baseline, generate uncertainty ranges, and agree in advance which manufacturing KPIs will justify expansion.
